 7
7peptides
spectra
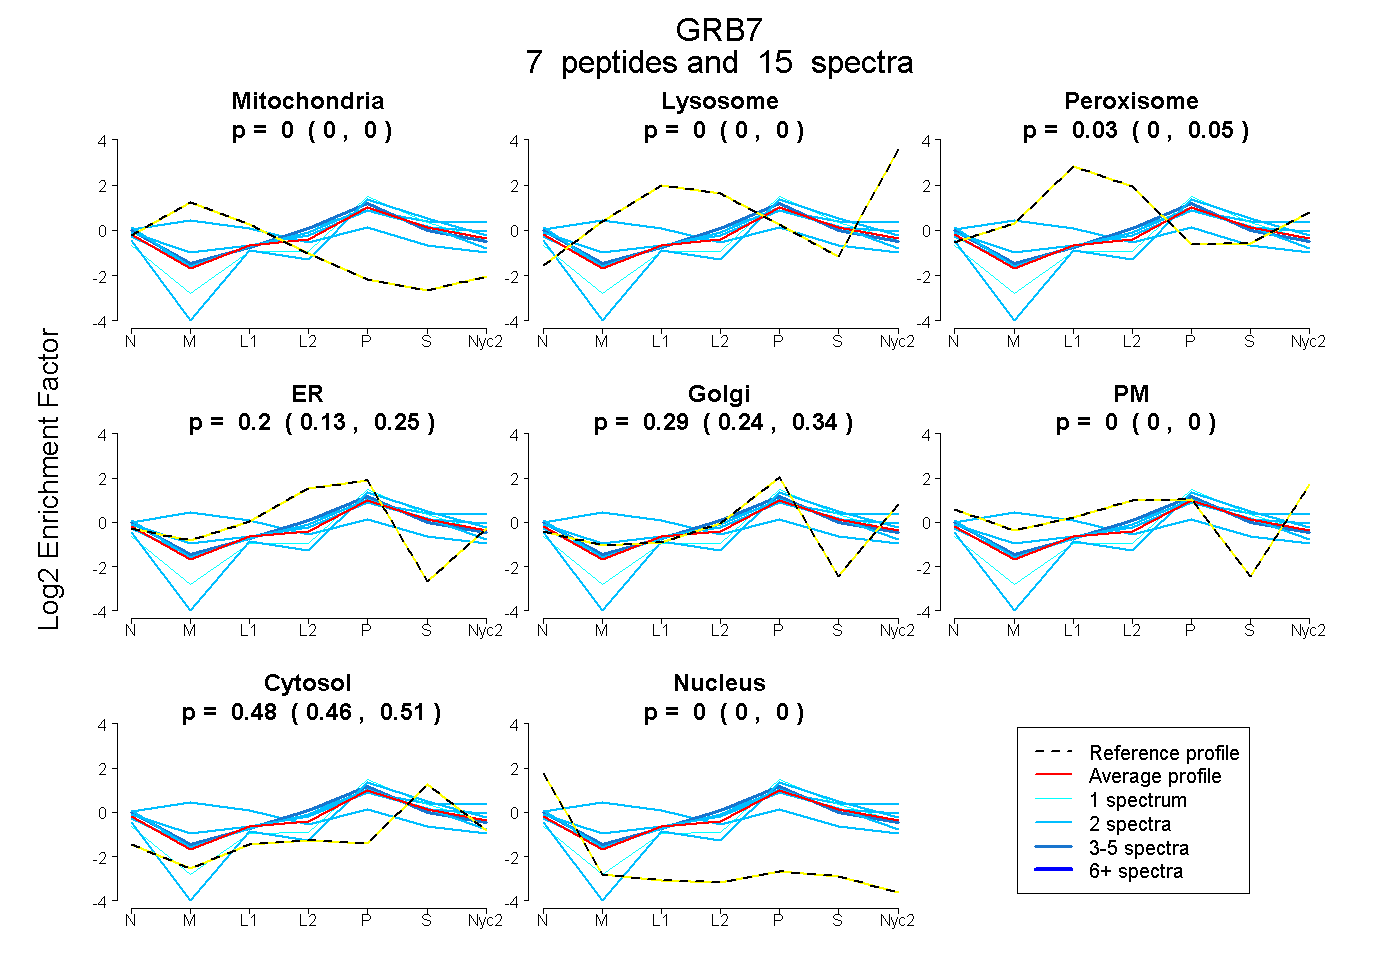
0.000 | 0.000
0.000 | 0.000
0.000 | 0.054
0.132 | 0.246
0.241 | 0.343
0.000 | 0.000
0.458 | 0.505
0.000 | 0.000
1peptide
spectrum
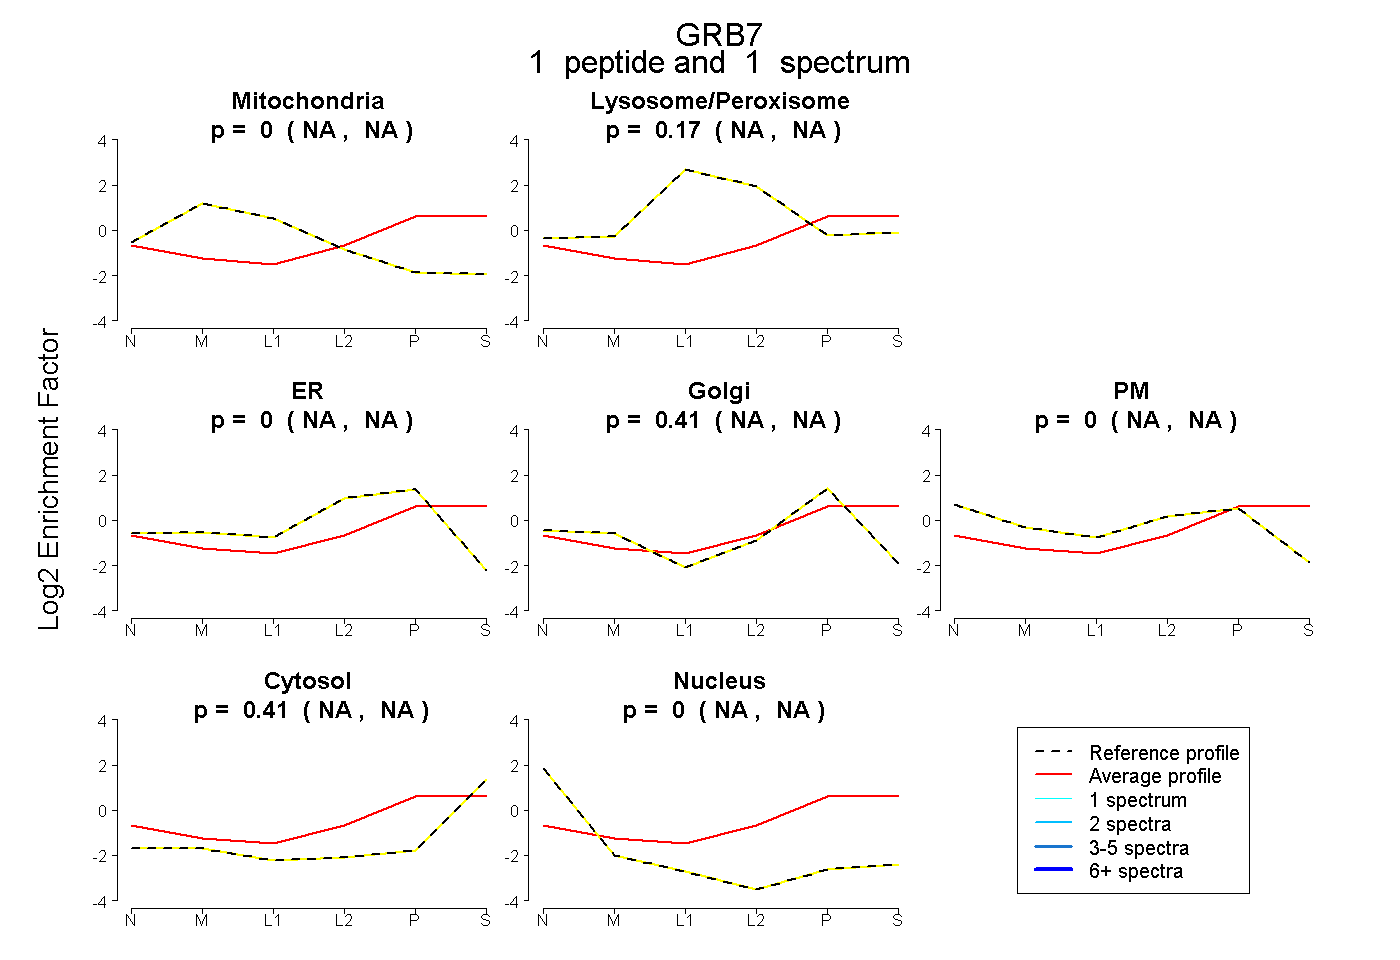
NA | NA
NA | NA
NA | NA
NA | NA
NA | NA
NA | NA
NA | NA
4peptides
spectra
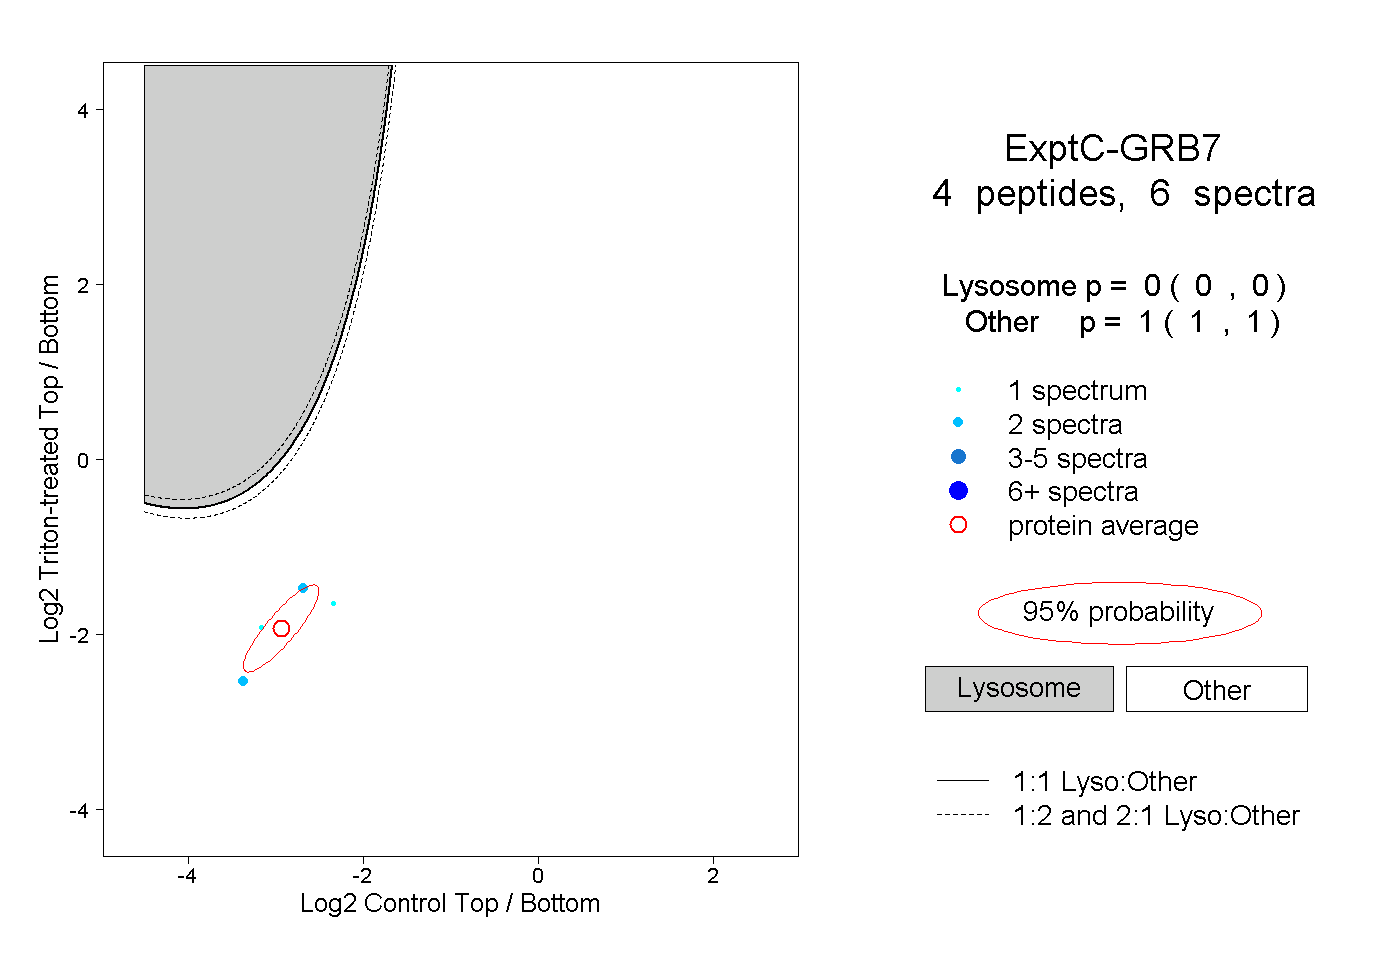
0.000 | 0.000
1.000 | 1.000