 7
7peptides
spectra
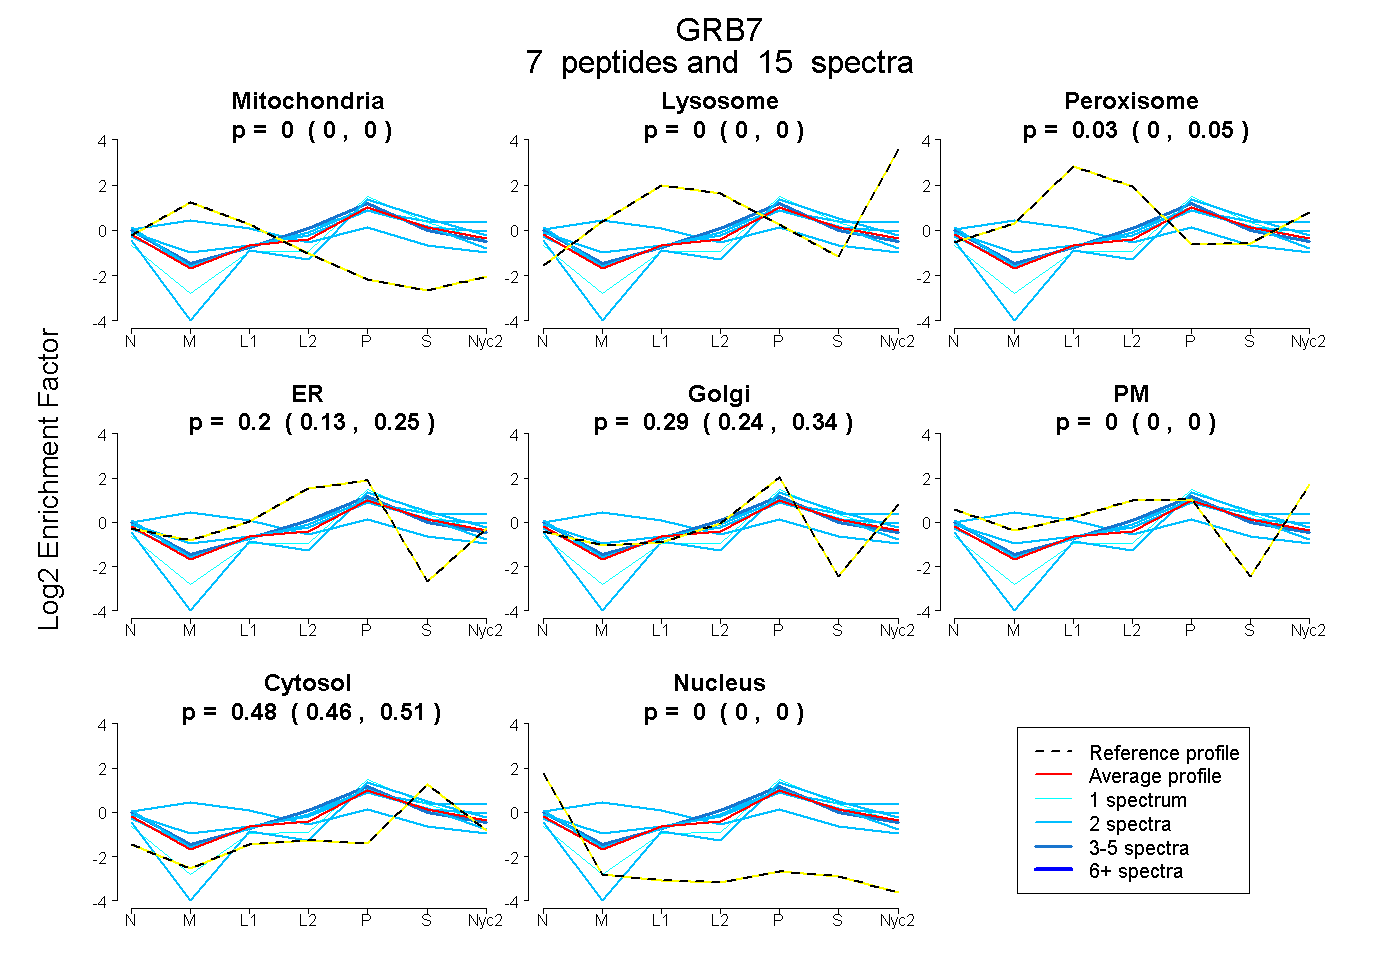
0.000 | 0.000
0.000 | 0.000
0.000 | 0.054
0.132 | 0.246
0.241 | 0.343
0.000 | 0.000
0.458 | 0.505
0.000 | 0.000
| Plot | Mito | Lyso | Perox | ER | Golgi | PM | Cytosol | Nucleus | |||||
| Expt A |
7 peptides |
15 spectra |
|
0.000 0.000 | 0.000 |
0.000 0.000 | 0.000 |
0.027 0.000 | 0.054 |
0.195 0.132 | 0.246 |
0.293 0.241 | 0.343 |
0.000 0.000 | 0.000 |
0.485 0.458 | 0.505 |
0.000 0.000 | 0.000 |
| 2 spectra, GILPCLLR | 0.358 | 0.000 | 0.181 | 0.001 | 0.274 | 0.000 | 0.186 | 0.000 | ||
| 2 spectra, SQPLPIPSSR | 0.000 | 0.000 | 0.000 | 0.000 | 0.370 | 0.000 | 0.630 | 0.000 | ||
| 1 spectrum, LSYLGSPPLR | 0.000 | 0.000 | 0.000 | 0.000 | 0.451 | 0.000 | 0.549 | 0.000 | ||
| 2 spectra, FTDLLQLVEFHQLNR | 0.000 | 0.024 | 0.053 | 0.038 | 0.249 | 0.172 | 0.463 | 0.000 | ||
| 2 spectra, SVEVAAGATAR | 0.000 | 0.000 | 0.000 | 0.178 | 0.177 | 0.185 | 0.460 | 0.000 | ||
| 4 spectra, NYQQAQSR | 0.000 | 0.000 | 0.000 | 0.401 | 0.137 | 0.019 | 0.443 | 0.000 | ||
| 2 spectra, YGVQLYK | 0.001 | 0.000 | 0.046 | 0.367 | 0.107 | 0.000 | 0.480 | 0.000 |
| Plot | Mito | Lyso or Perox | ER | Golgi | PM | Cytosol | Nucleus | ||||||
| Expt B |
1 peptide |
1 spectrum |
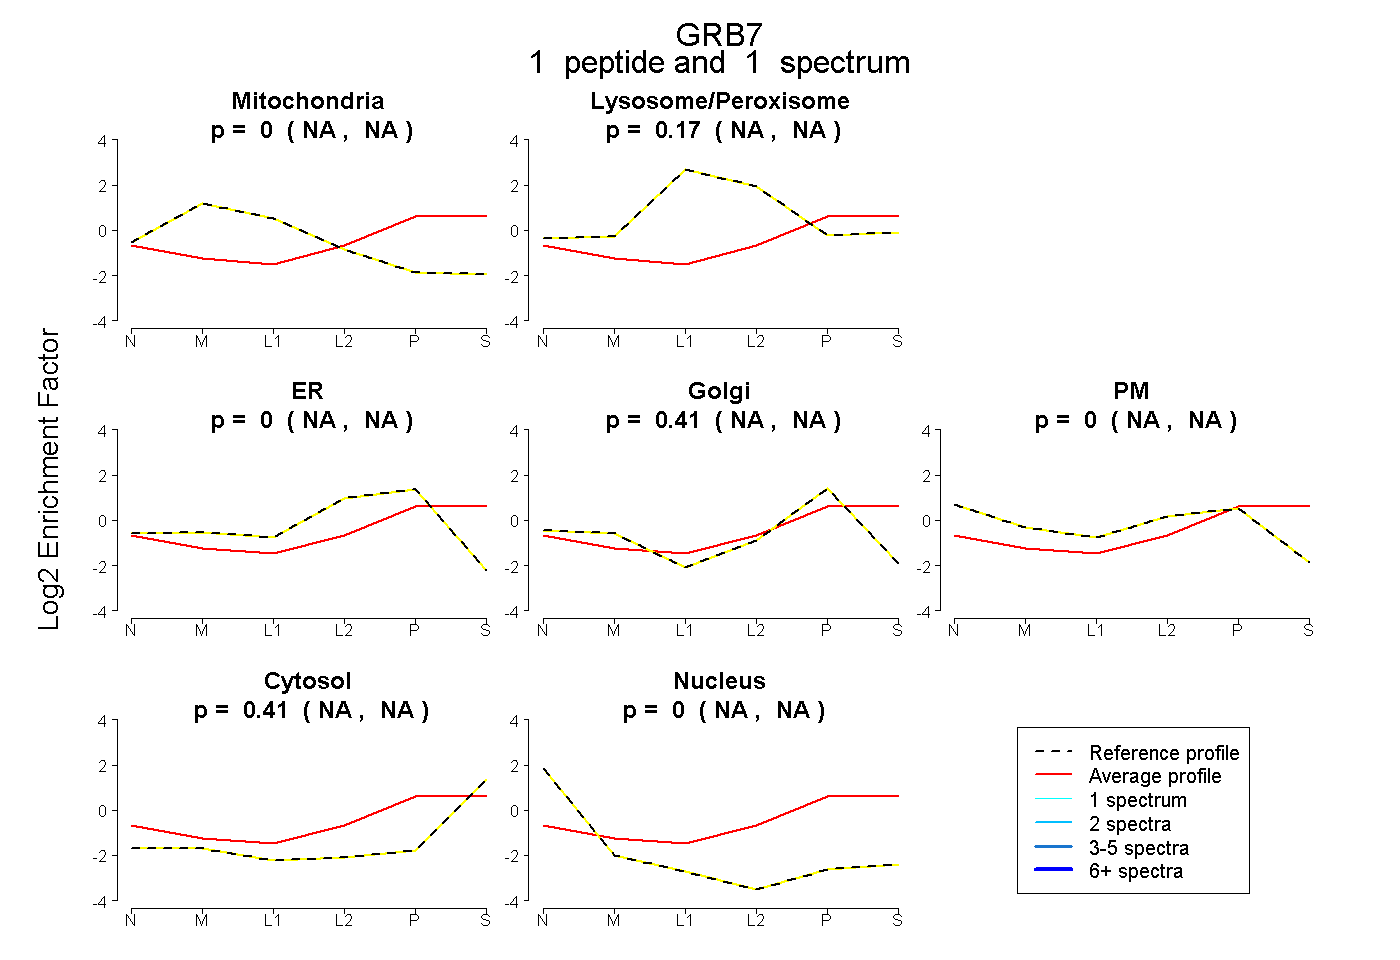 |
0.000 NA | NA |
0.173 NA | NA |
0.000 NA | NA |
0.414 NA | NA |
0.000 NA | NA |
0.413 NA | NA |
0.000 NA | NA |
|||
| Plot | Lyso | Other | |||||||||||
| Expt C |
4 peptides |
6 spectra |
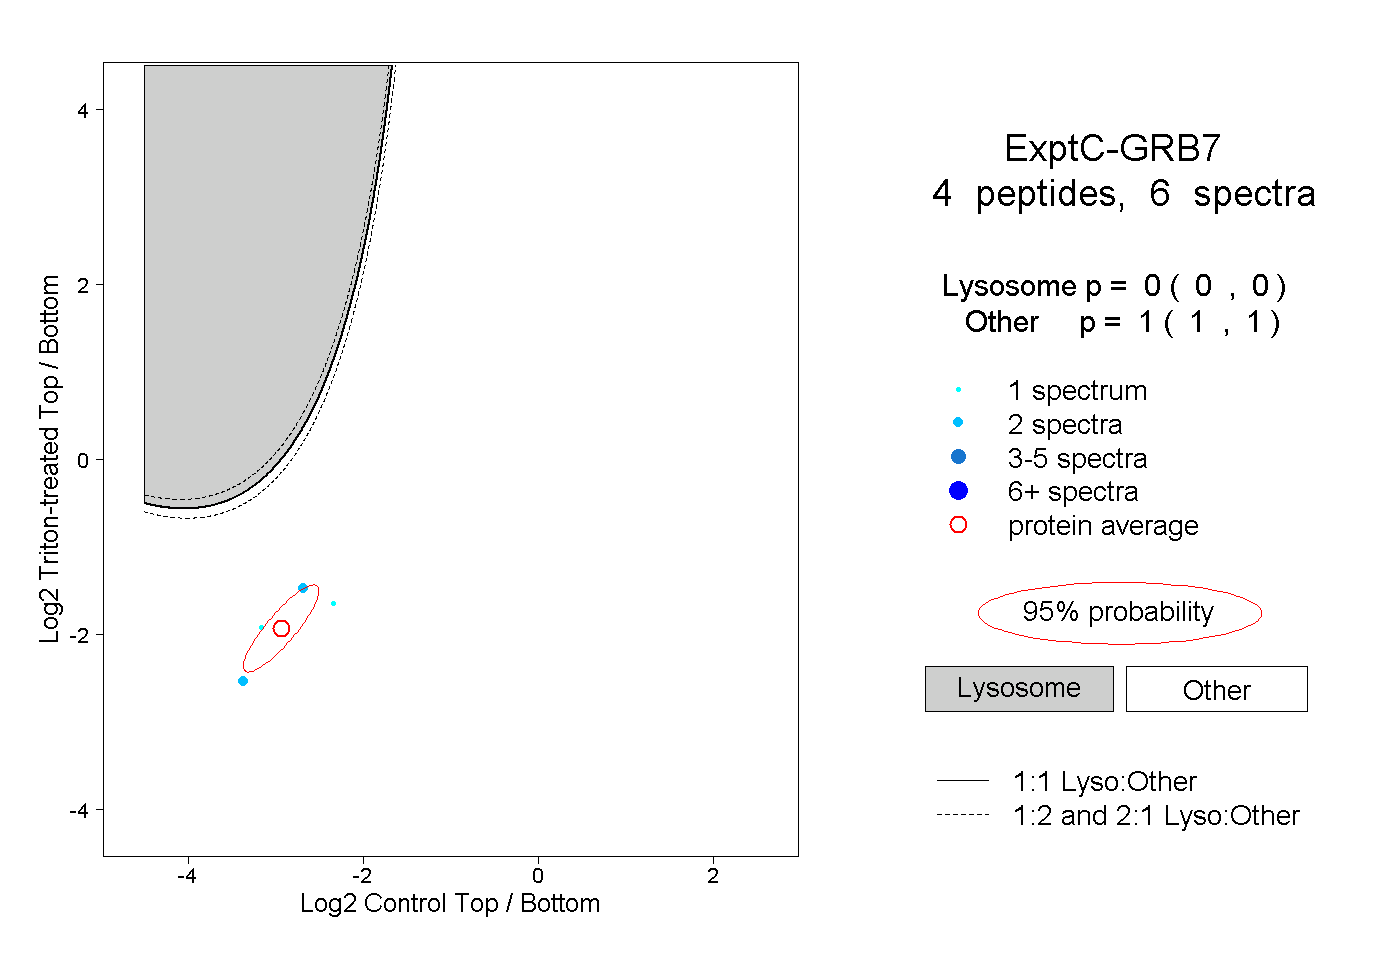 |
0.000 0.000 | 0.000 |
1.000 1.000 | 1.000 |