 3
3peptides
spectra
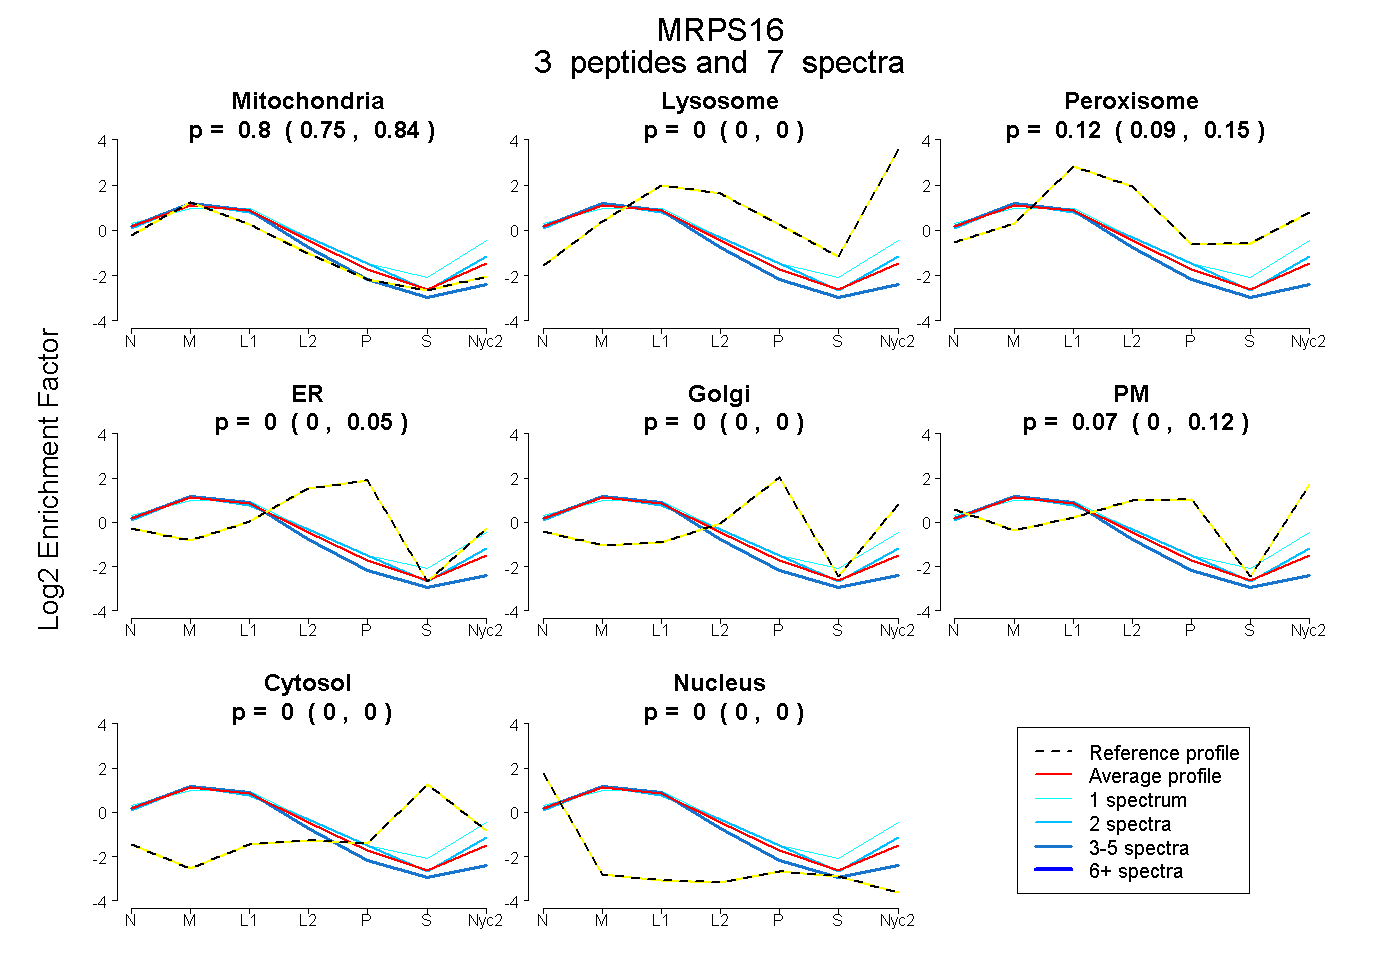
0.746 | 0.843
0.000 | 0.000
0.092 | 0.149
0.000 | 0.052
0.000 | 0.000
0.000 | 0.124
0.000 | 0.000
0.000 | 0.000
2peptides
spectra
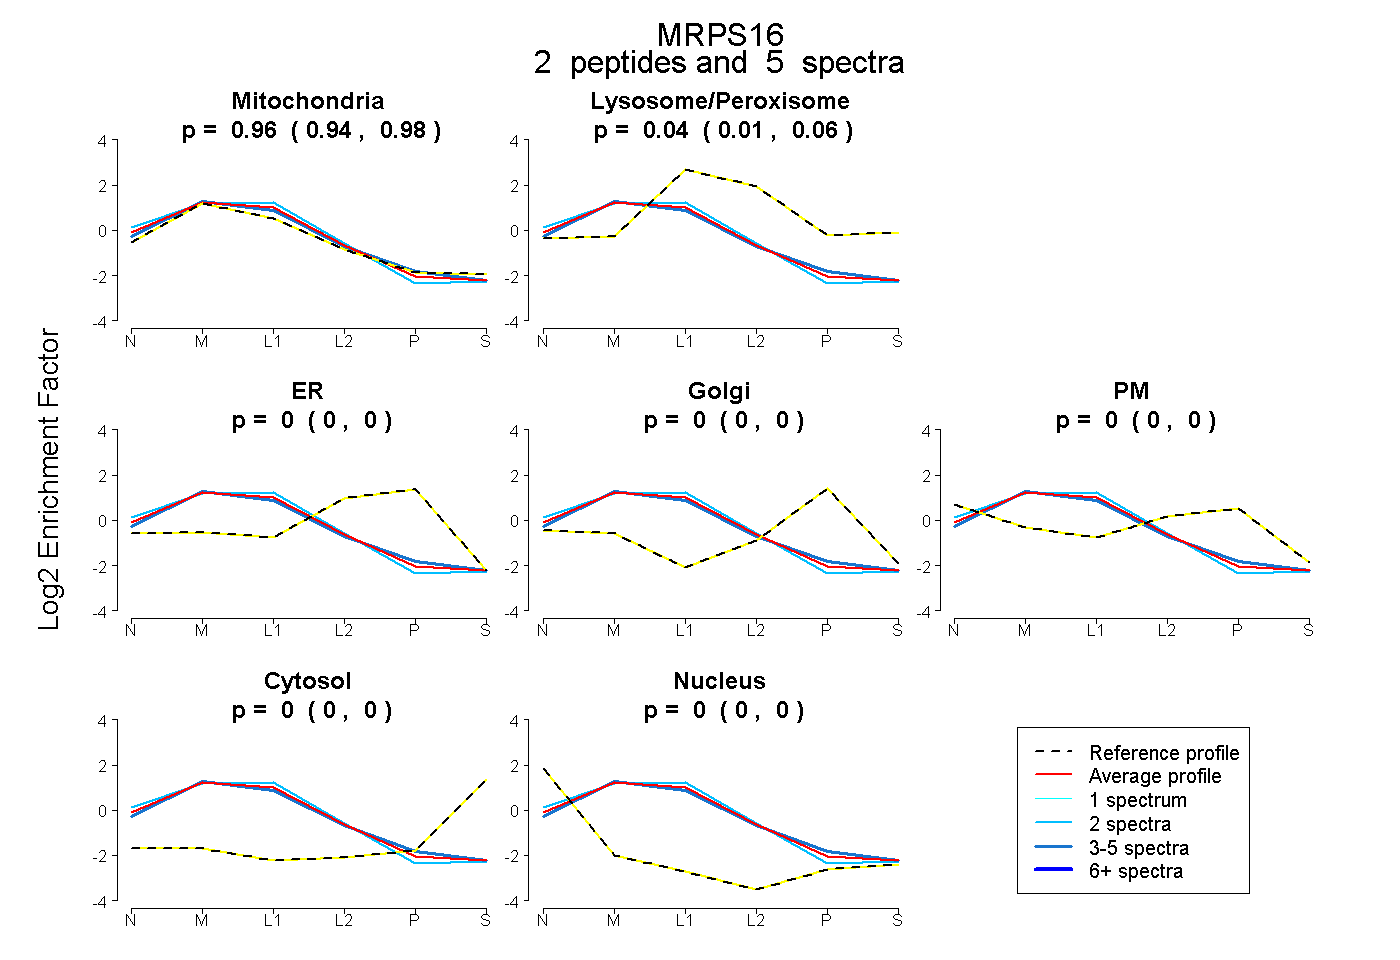
0.937 | 0.984
0.012 | 0.059
0.000 | 0.000
0.000 | 0.000
0.000 | 0.000
0.000 | 0.000
0.000 | 0.000
4peptides
spectra
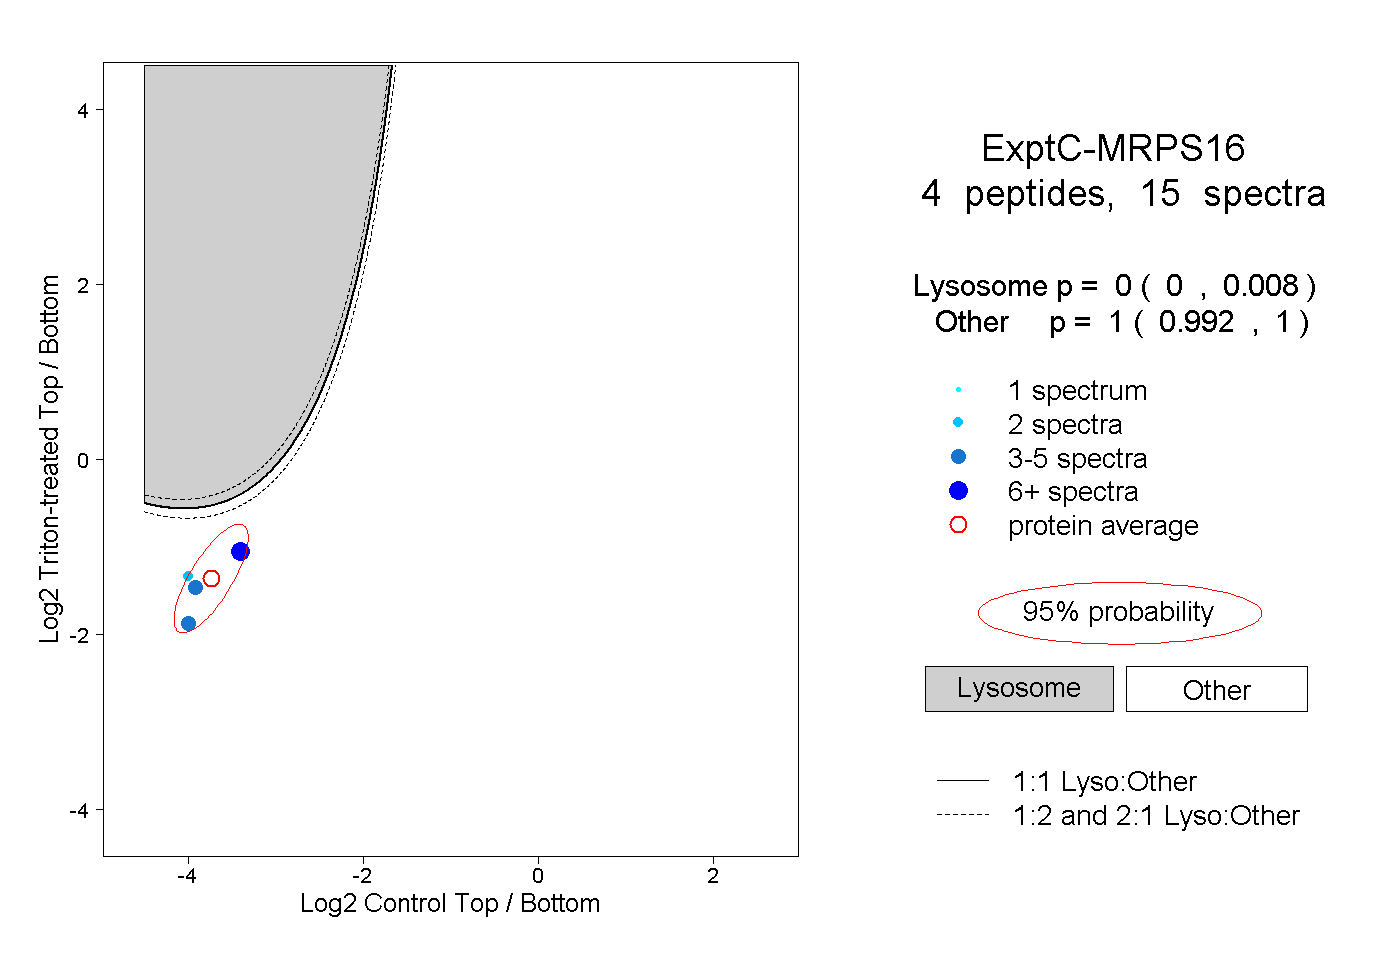
0.000 | 0.008
0.992 | 1.000