 3
3peptides
spectra
0.746 | 0.843
0.000 | 0.000
0.092 | 0.149
0.000 | 0.052
0.000 | 0.000
0.000 | 0.124
0.000 | 0.000
0.000 | 0.000
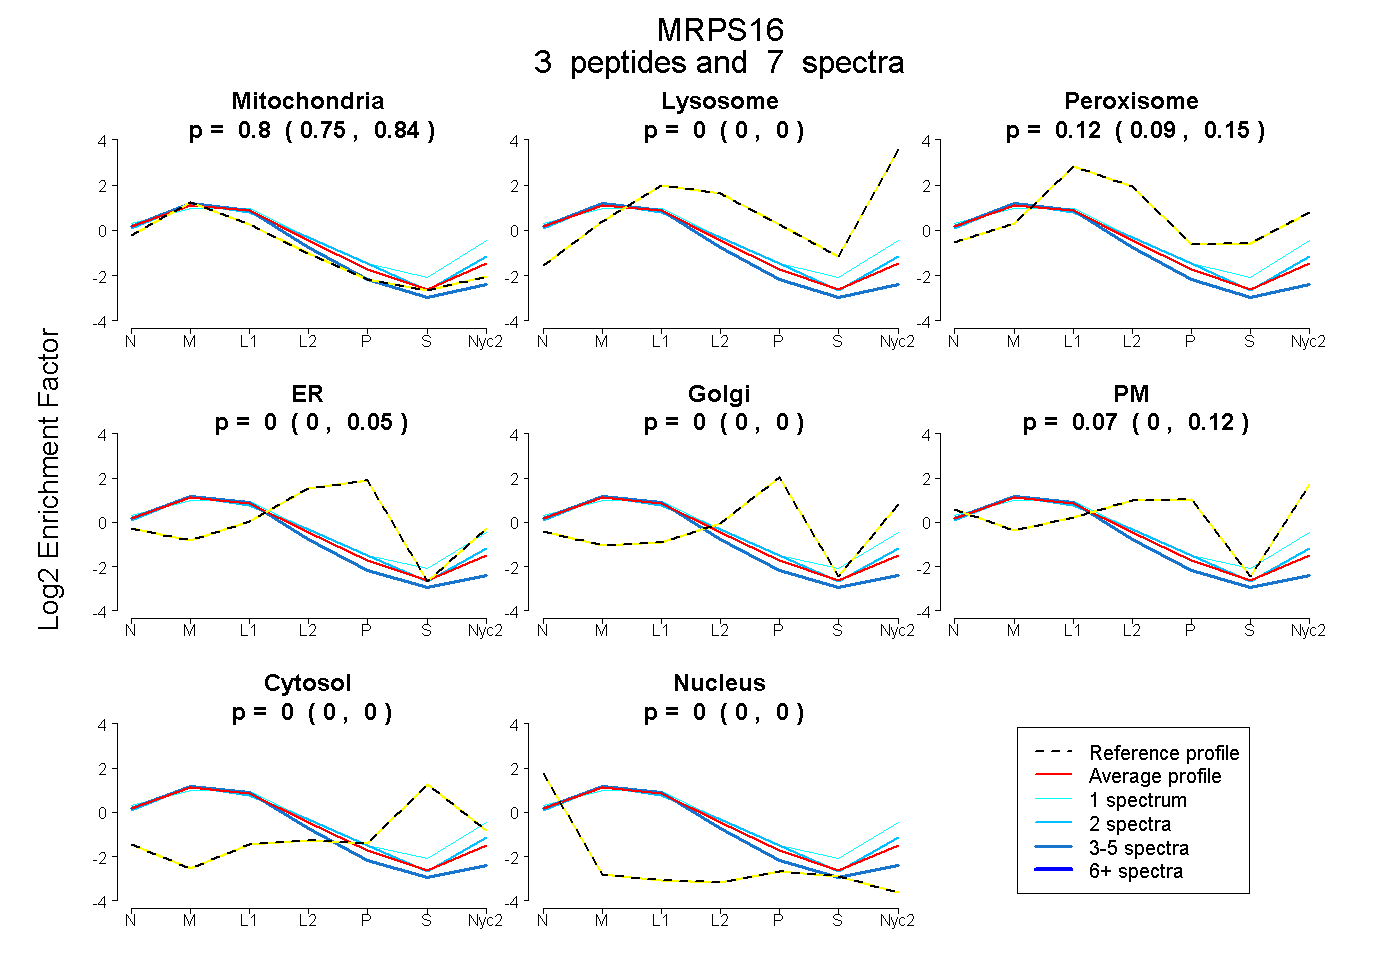
| Plot | Mito | Lyso | Perox | ER | Golgi | PM | Cytosol | Nucleus | |||||
| Expt A |
3 peptides |
7 spectra |
|
0.803 0.746 | 0.843 |
0.000 0.000 | 0.000 |
0.125 0.092 | 0.149 |
0.000 0.000 | 0.052 |
0.000 0.000 | 0.000 |
0.072 0.000 | 0.124 |
0.000 0.000 | 0.000 |
0.000 0.000 | 0.000 |
| 2 spectra, IVAAHNK | 0.738 | 0.000 | 0.115 | 0.000 | 0.000 | 0.147 | 0.000 | 0.000 | ||
| 4 spectra, LALGGCTNRPFYR | 0.978 | 0.000 | 0.022 | 0.000 | 0.000 | 0.000 | 0.000 | 0.000 | ||
| 1 spectrum, EVFLASQK | 0.615 | 0.025 | 0.196 | 0.000 | 0.000 | 0.164 | 0.000 | 0.000 |
| Plot | Mito | Lyso or Perox | ER | Golgi | PM | Cytosol | Nucleus | ||||||
| Expt B |
2 peptides |
5 spectra |
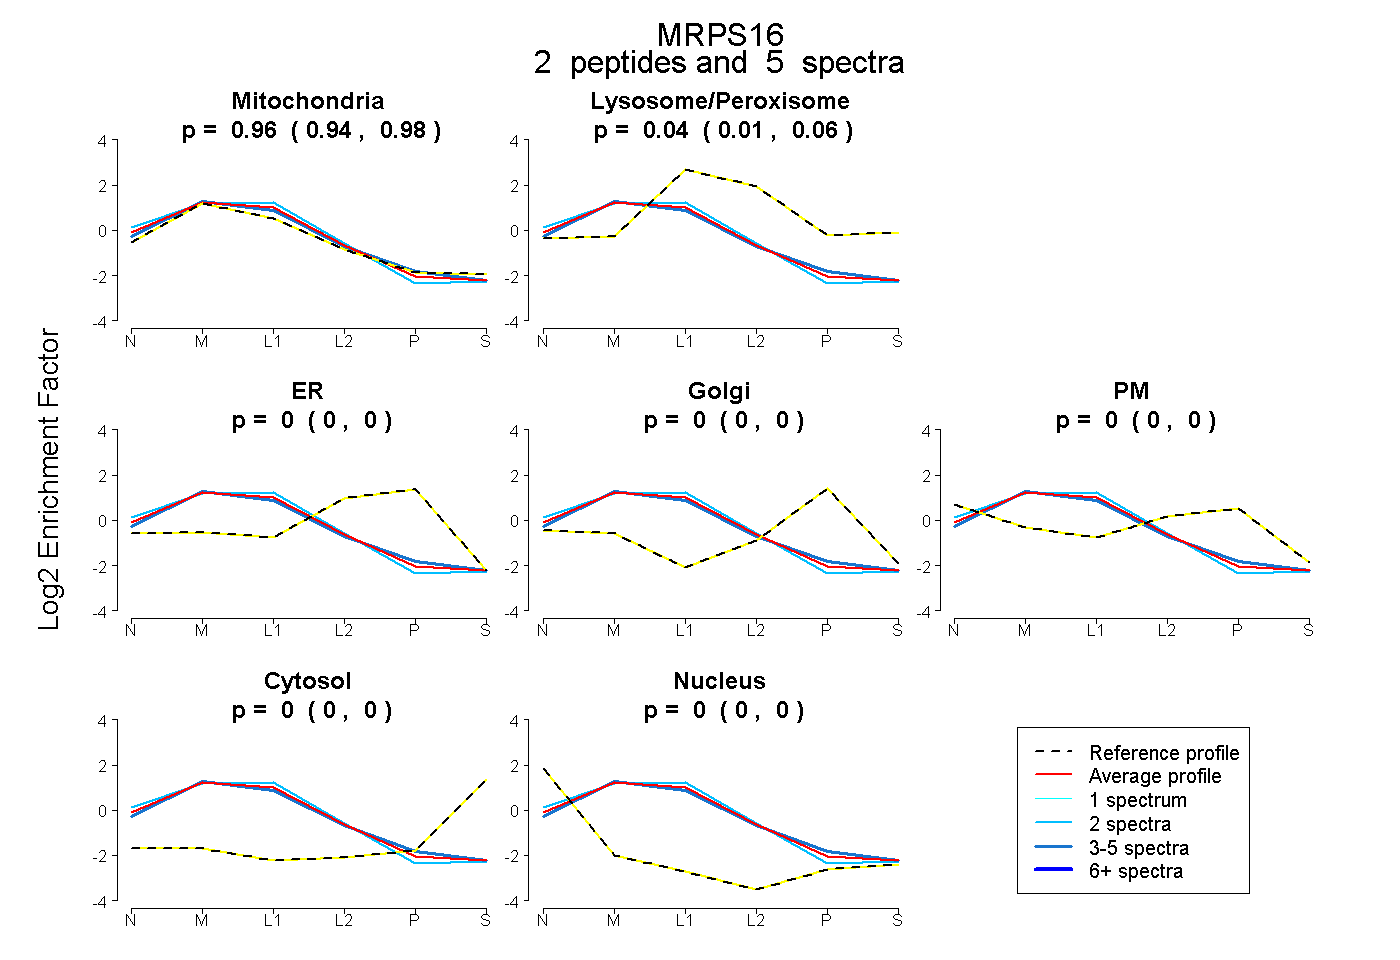 |
0.963 0.937 | 0.984 |
0.037 0.012 | 0.059 |
0.000 0.000 | 0.000 |
0.000 0.000 | 0.000 |
0.000 0.000 | 0.000 |
0.000 0.000 | 0.000 |
0.000 0.000 | 0.000 |
|||
| Plot | Lyso | Other | |||||||||||
| Expt C |
4 peptides |
15 spectra |
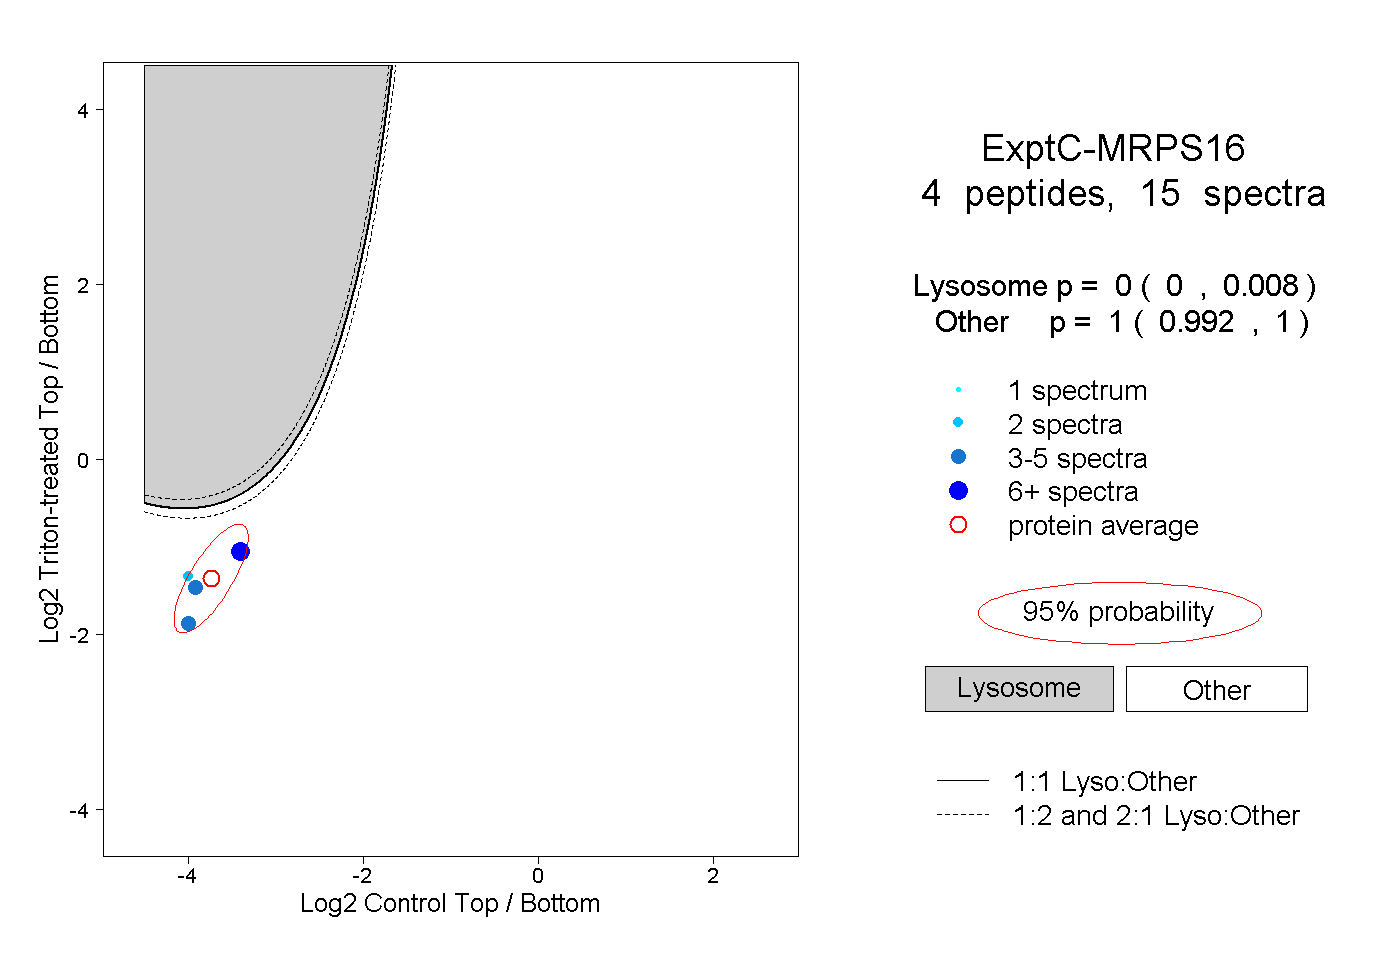 |
0.000 0.000 | 0.008 |
1.000 0.992 | 1.000 |