 2
2peptides
spectra
0.000 | 0.000
0.150 | 0.236
0.000 | 0.127
0.000 | 0.000
0.258 | 0.399
0.086 | 0.246
0.186 | 0.266
0.000 | 0.000
| Plot | Mito | Lyso | Perox | ER | Golgi | PM | Cytosol | Nucleus | |||||
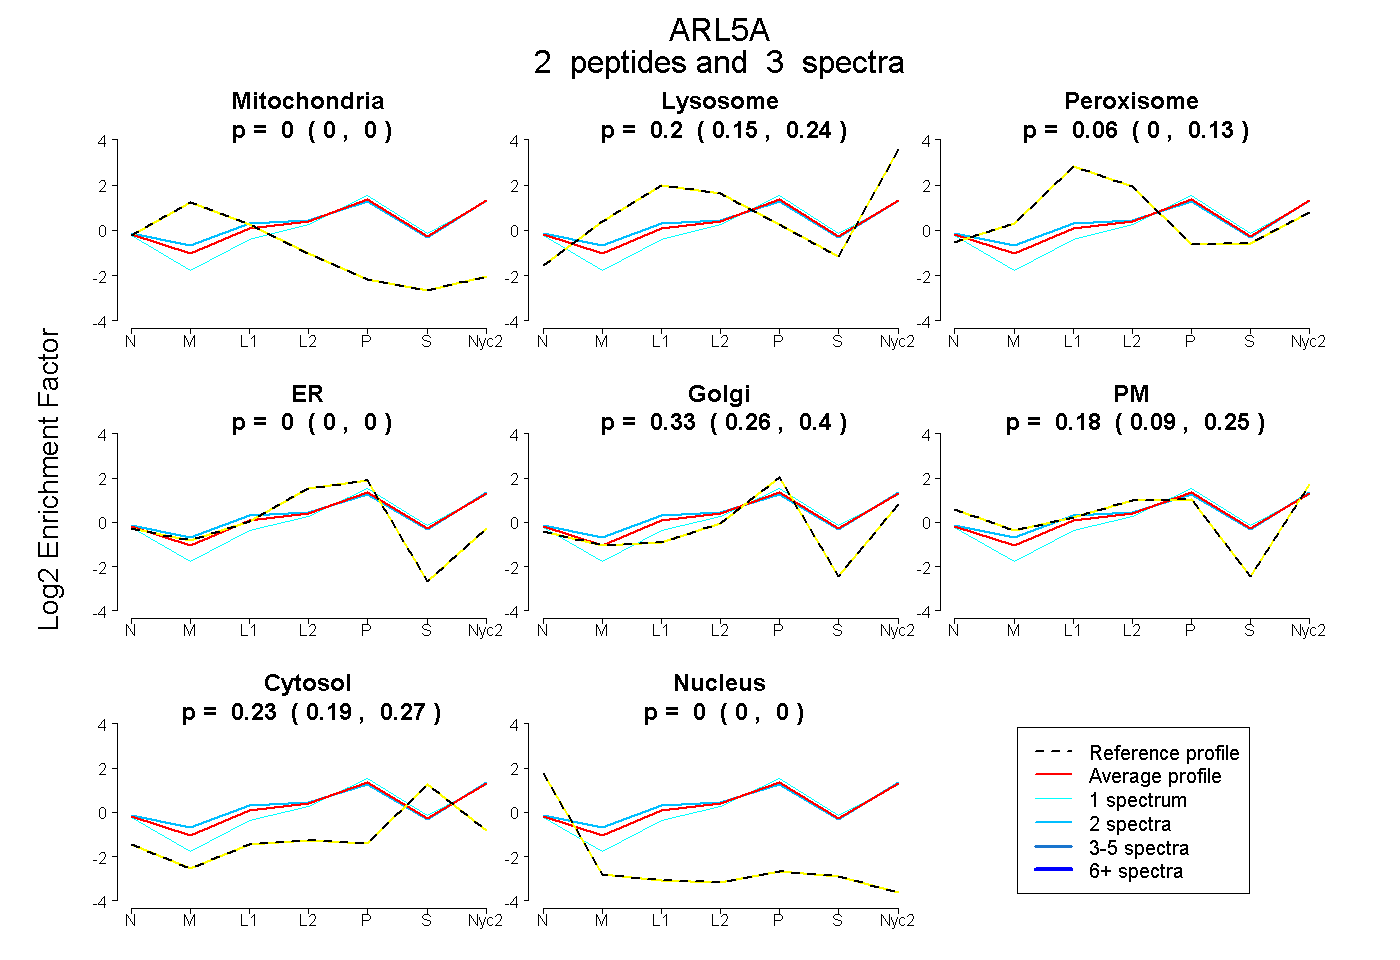
| Expt A |
2 peptides |
3 spectra |
|
0.000 0.000 | 0.000 |
0.200 0.150 | 0.236 |
0.058 0.000 | 0.127 |
0.000 0.000 | 0.000 |
0.331 0.258 | 0.399 |
0.180 0.086 | 0.246 |
0.232 0.186 | 0.266 |
0.000 0.000 | 0.000 |
| 2 spectra, ECMTVAEISQFLK | 0.000 | 0.191 | 0.131 | 0.000 | 0.307 | 0.182 | 0.189 | 0.000 | ||
| 1 spectrum, AGLLIFANK | 0.000 | 0.173 | 0.000 | 0.000 | 0.456 | 0.083 | 0.288 | 0.000 |
| Plot | Mito | Lyso or Perox | ER | Golgi | PM | Cytosol | Nucleus | ||||||
| Expt B |
1 peptide |
2 spectra |
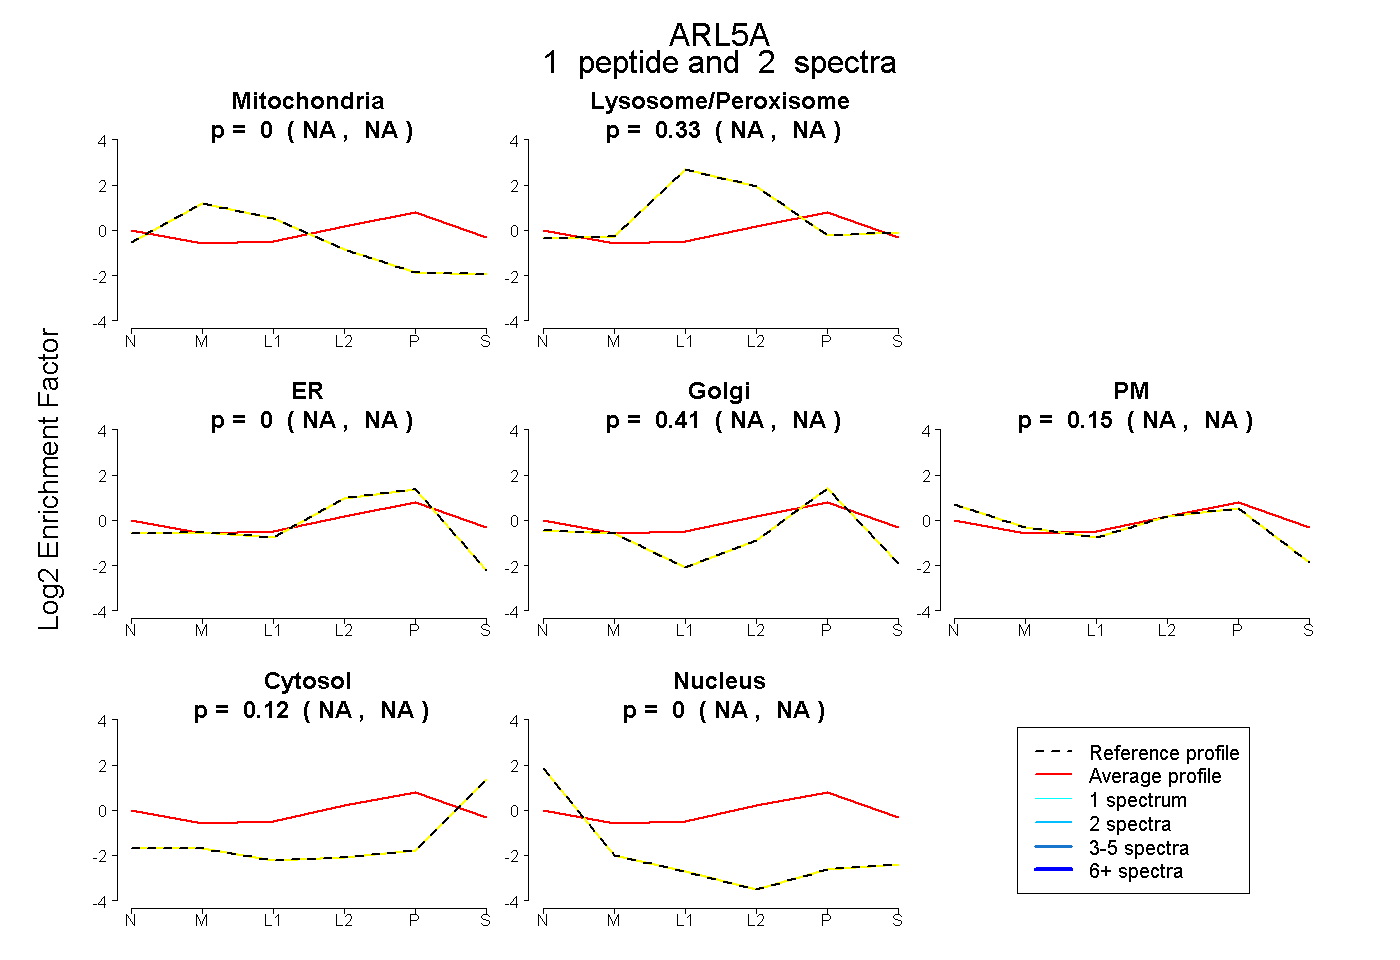 |
0.000 NA | NA |
0.328 NA | NA |
0.000 NA | NA |
0.408 NA | NA |
0.145 NA | NA |
0.118 NA | NA |
0.000 NA | NA |
|||
| Plot | Lyso | Other | |||||||||||
| Expt C |
3 peptides |
7 spectra |
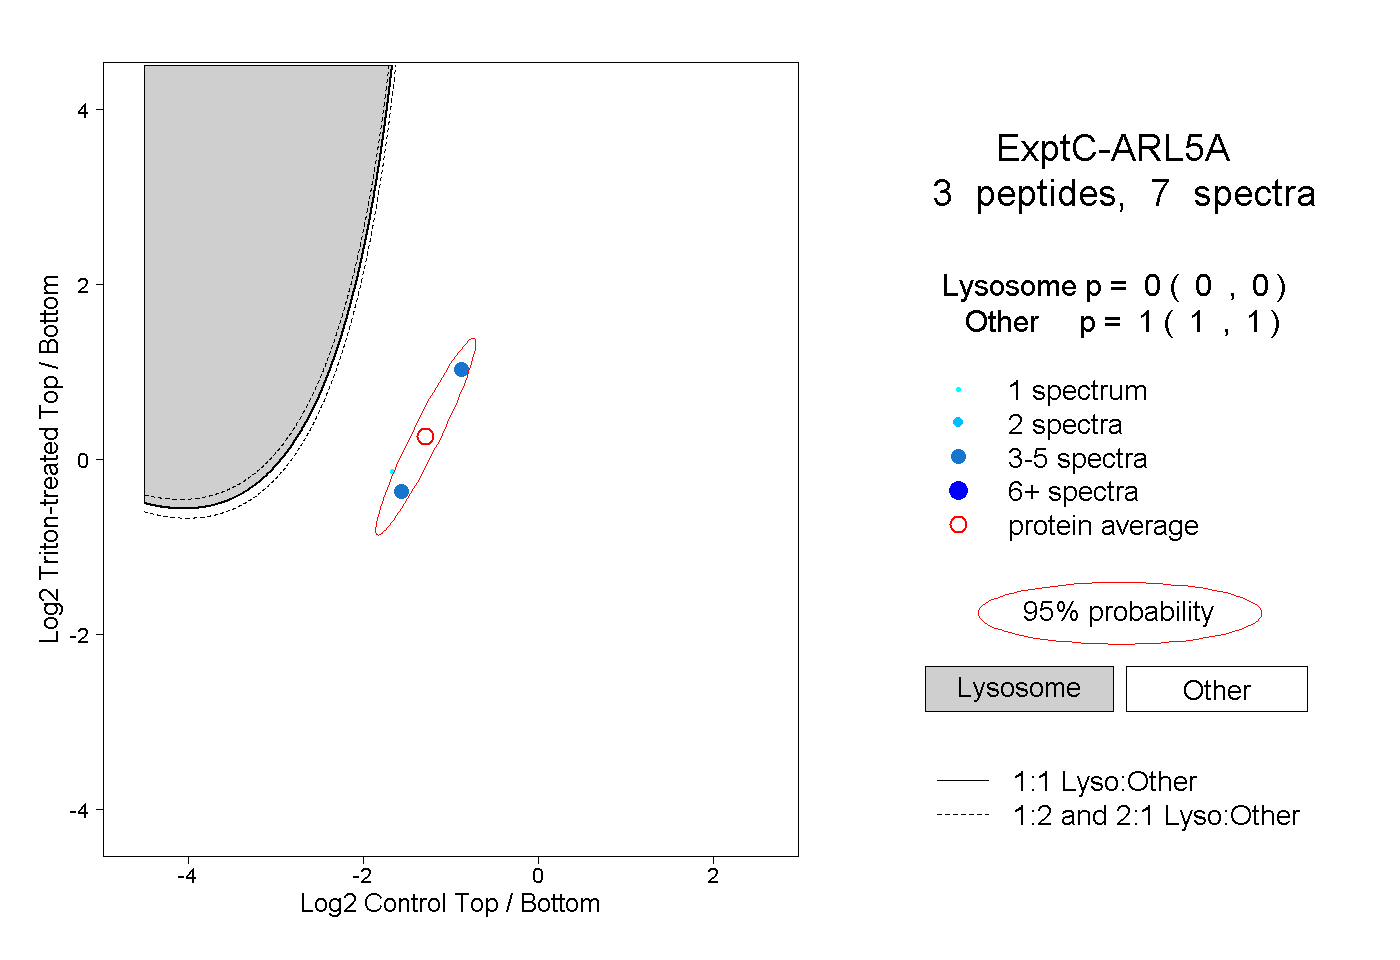 |
0.000 0.000 | 0.000 |
1.000 1.000 | 1.000 |