 2
2peptides
spectra
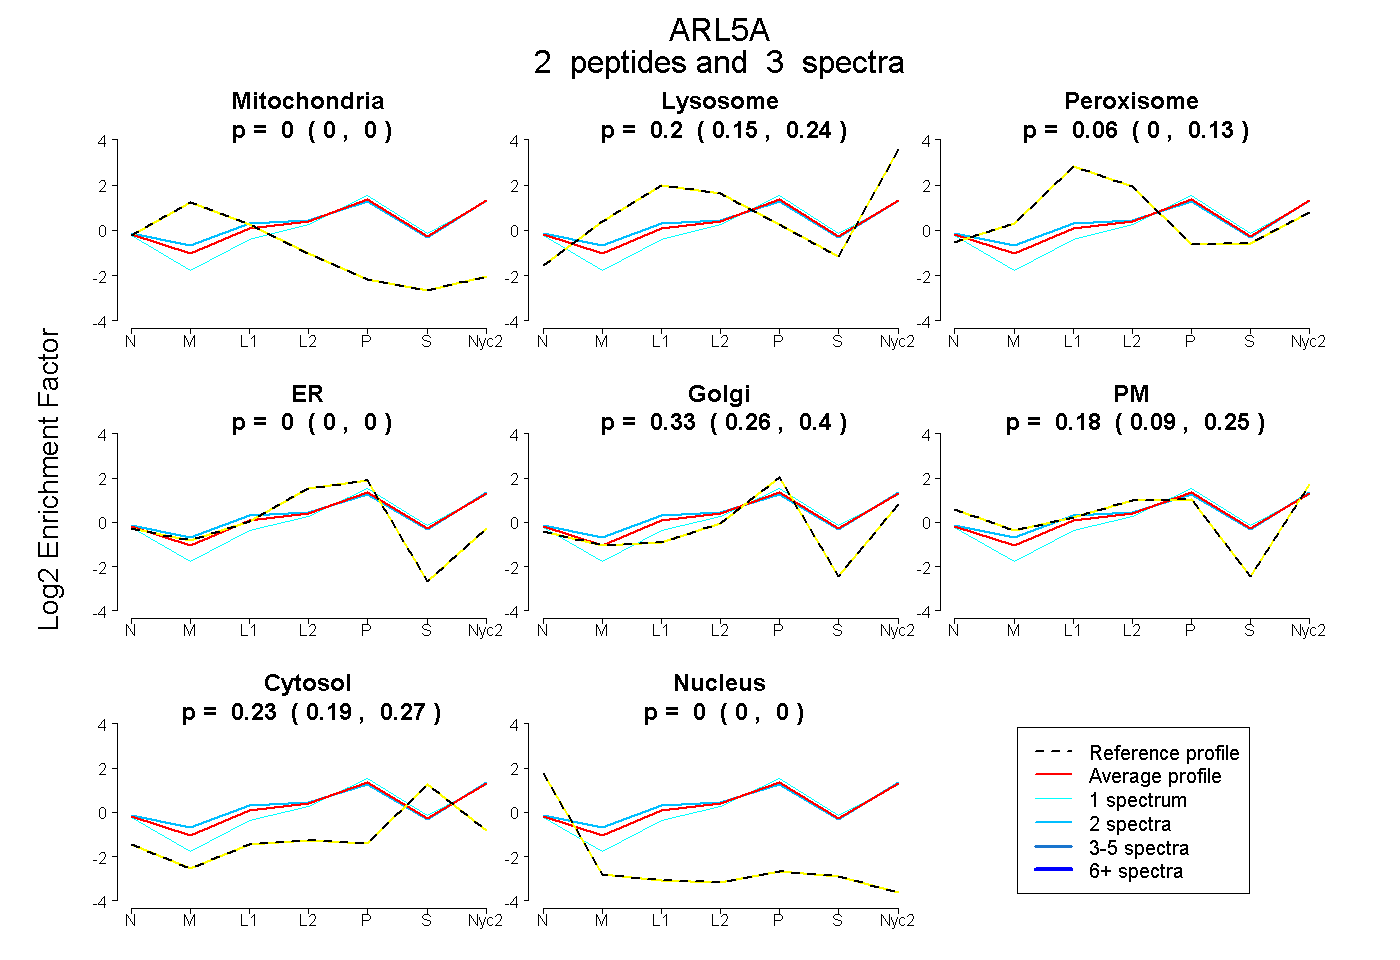
0.000 | 0.000
0.150 | 0.236
0.000 | 0.127
0.000 | 0.000
0.258 | 0.399
0.086 | 0.246
0.186 | 0.266
0.000 | 0.000
1peptide
spectra
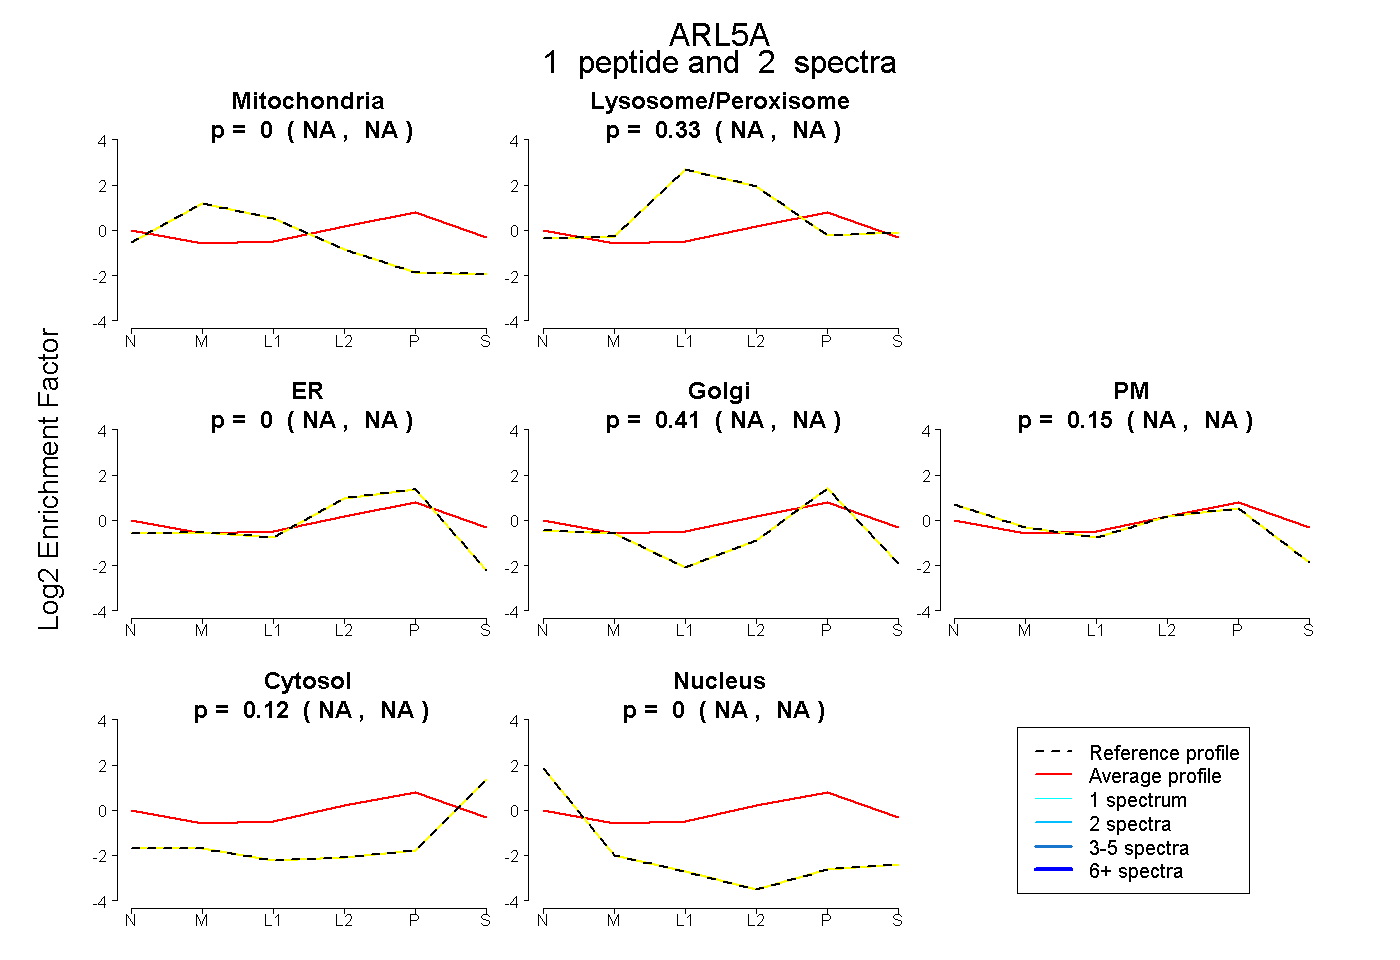
NA | NA
NA | NA
NA | NA
NA | NA
NA | NA
NA | NA
NA | NA
3peptides
spectra
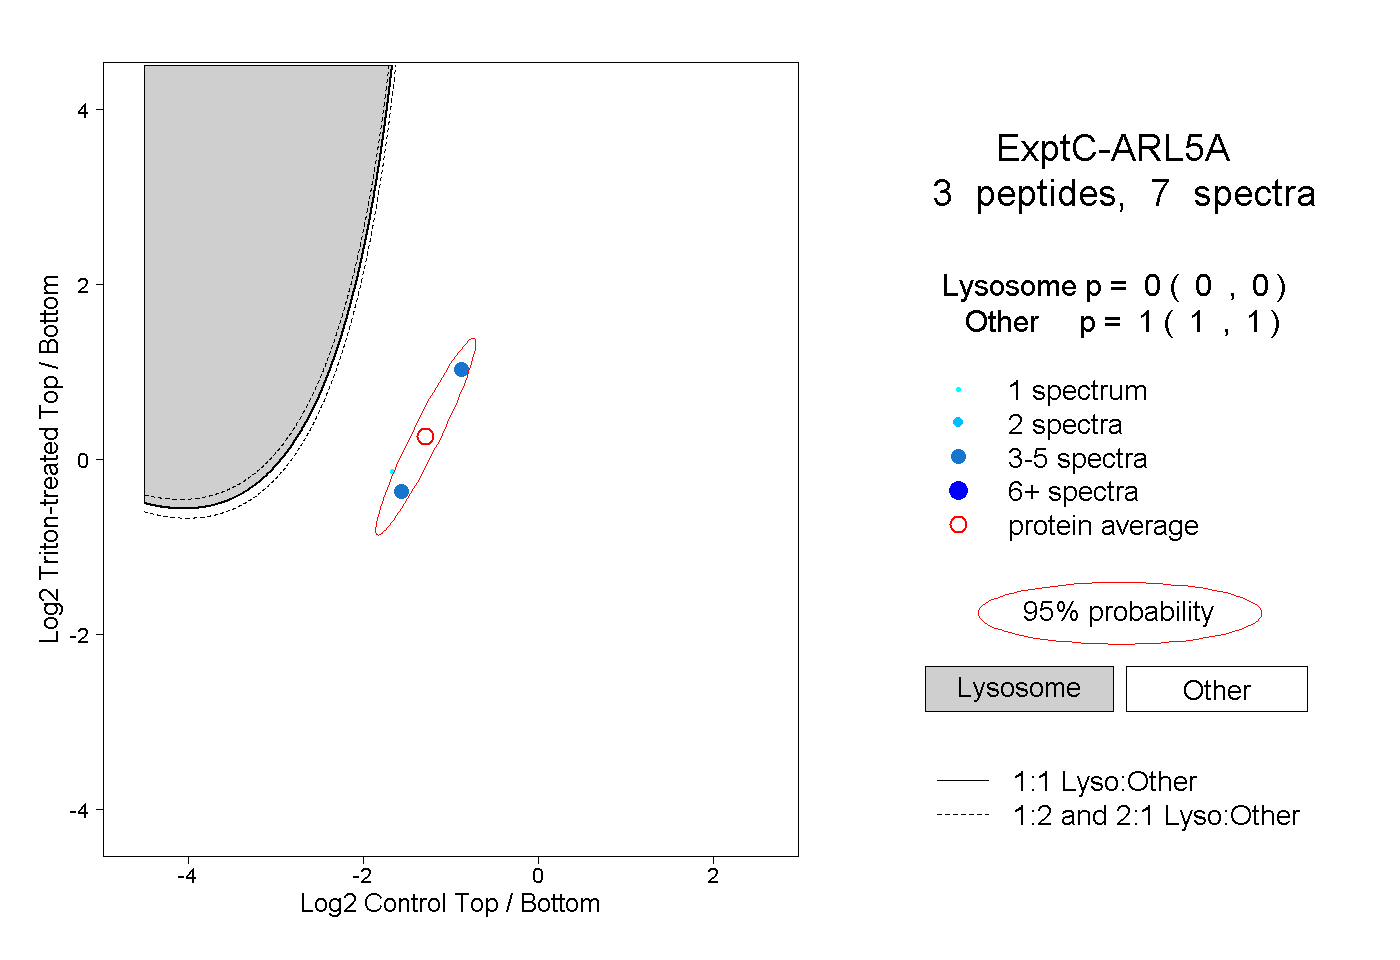
0.000 | 0.000
1.000 | 1.000