 9
9peptides
spectra
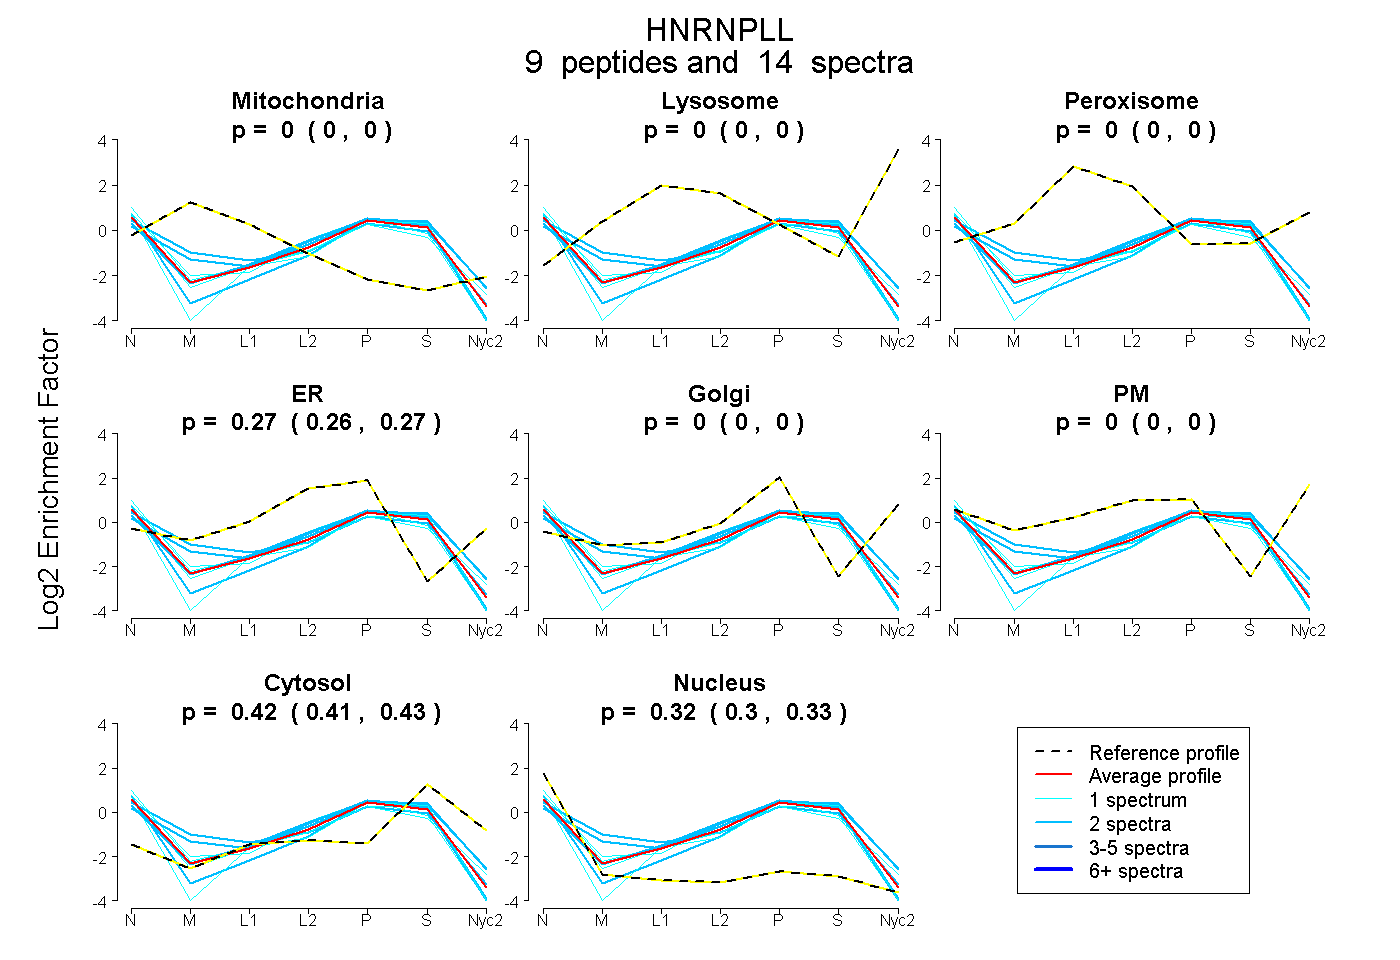
0.000 | 0.000
0.000 | 0.000
0.000 | 0.000
0.257 | 0.275
0.000 | 0.000
0.000 | 0.000
0.406 | 0.427
0.304 | 0.326
3peptides
spectra
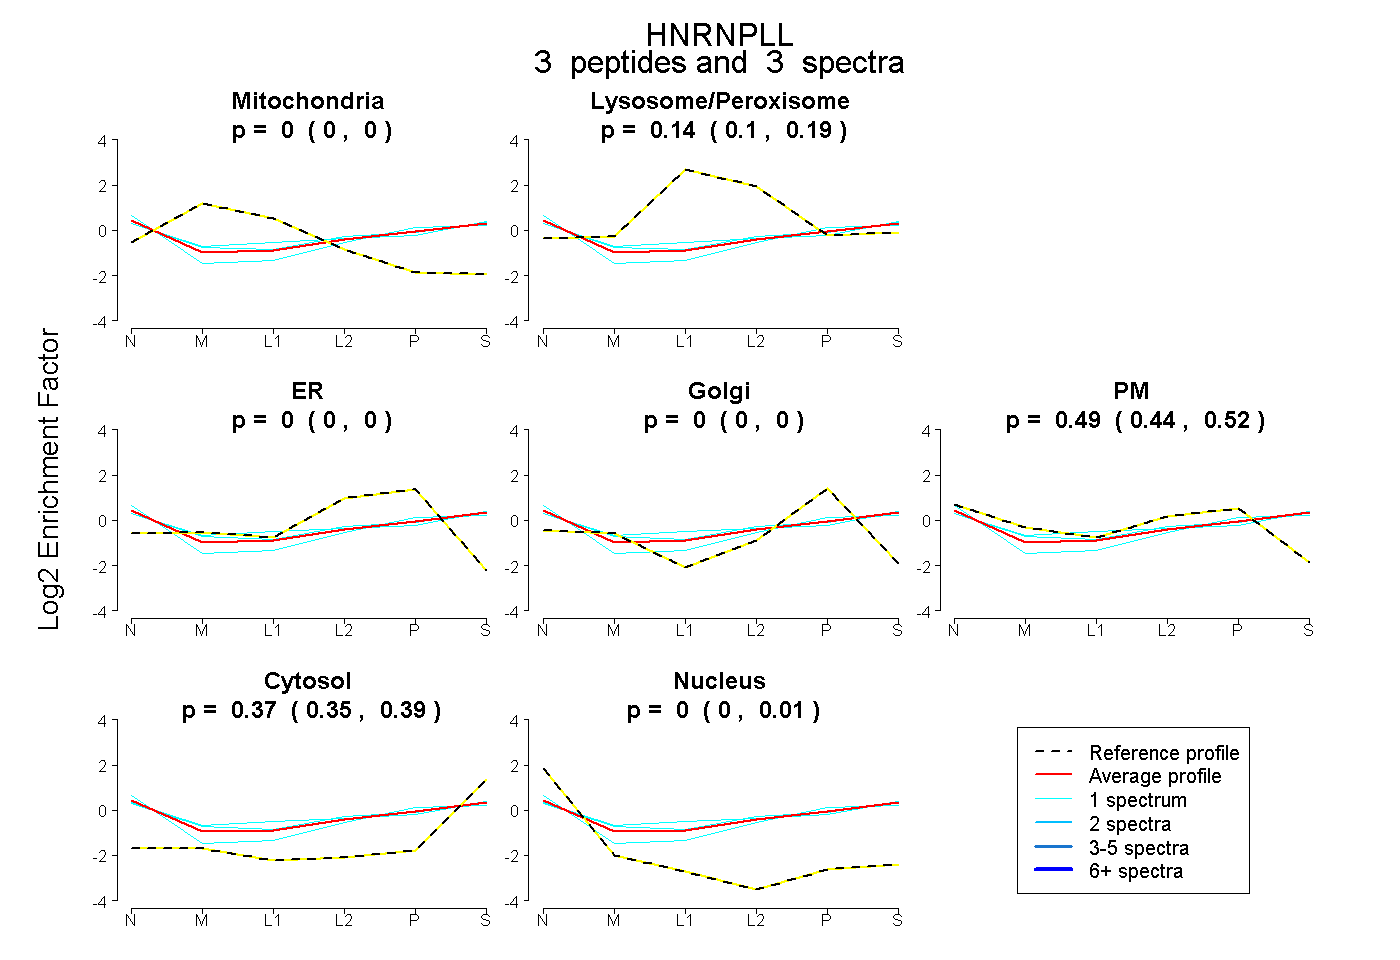
0.000 | 0.000
0.096 | 0.185
0.000 | 0.000
0.000 | 0.000
0.435 | 0.519
0.346 | 0.392
0.000 | 0.009
6peptides
spectra
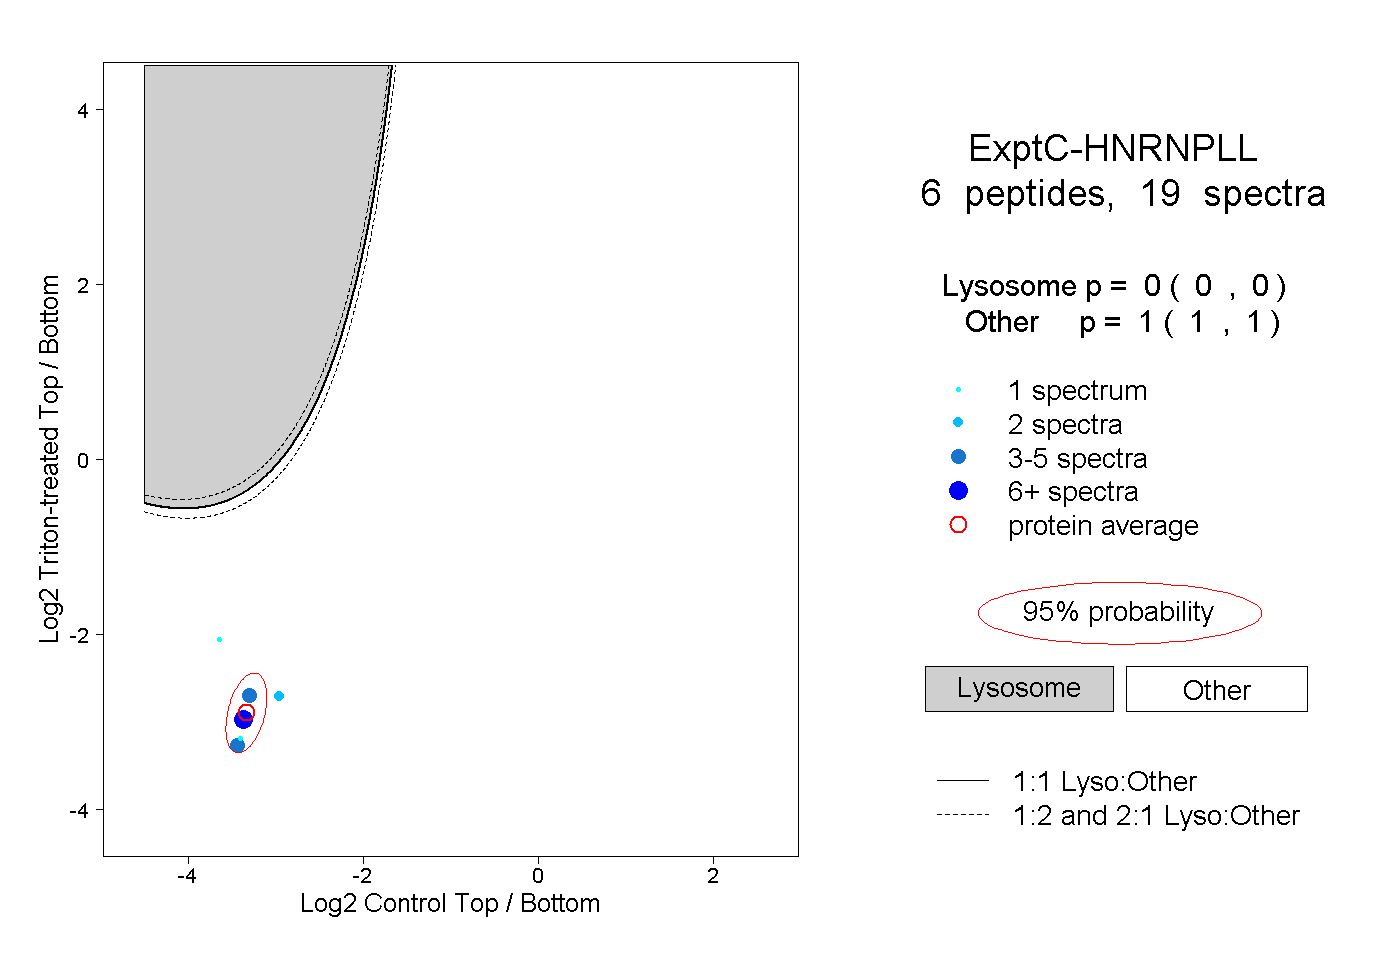
0.000 | 0.000
1.000 | 1.000
2peptides
spectra
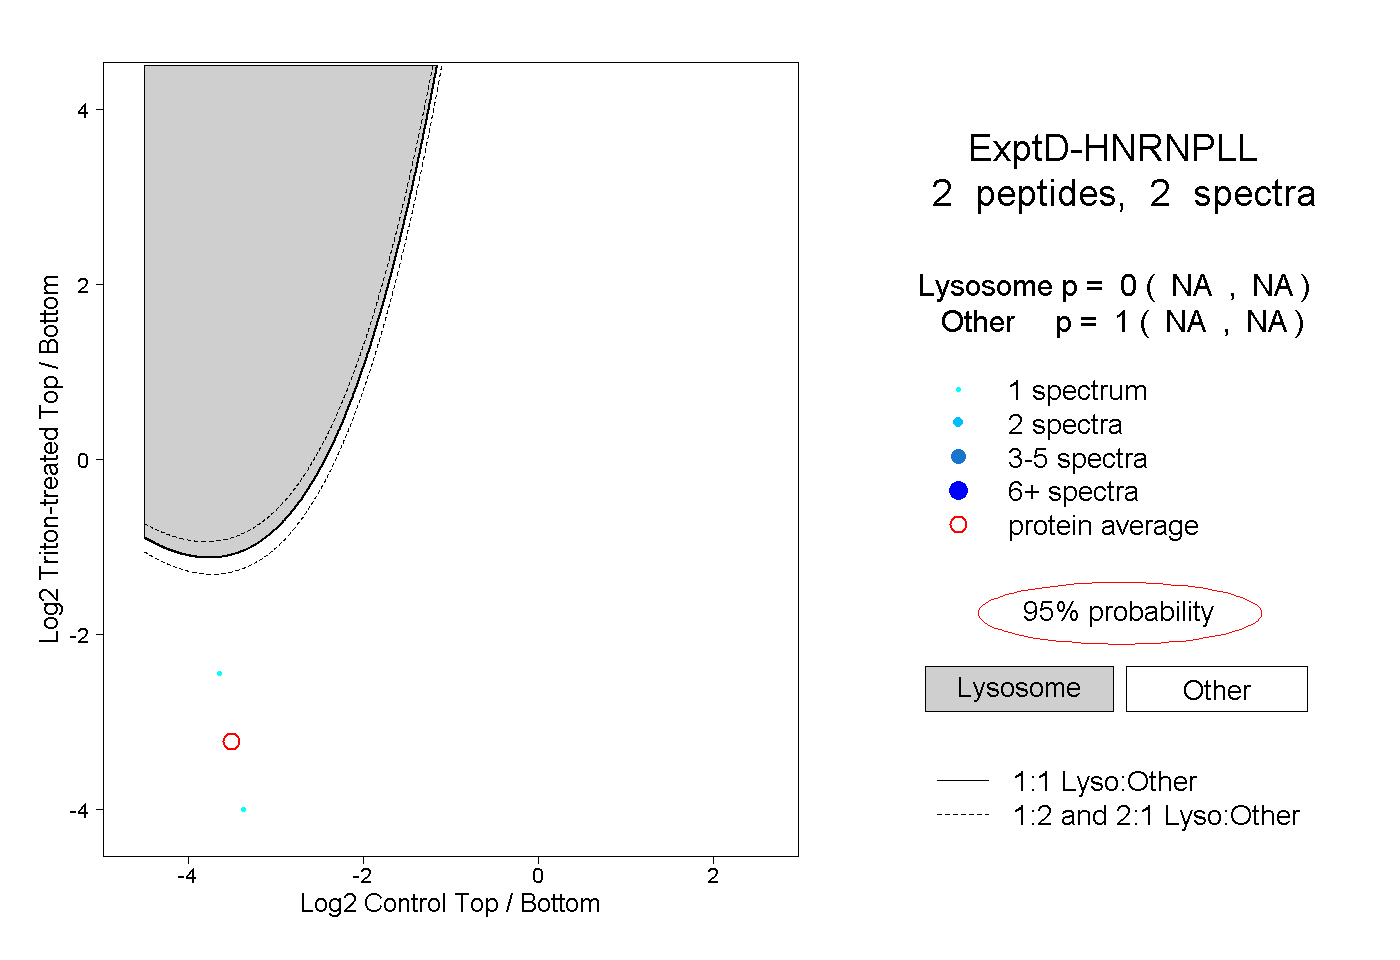
NA | NA
NA | NA