 9
9peptides
spectra
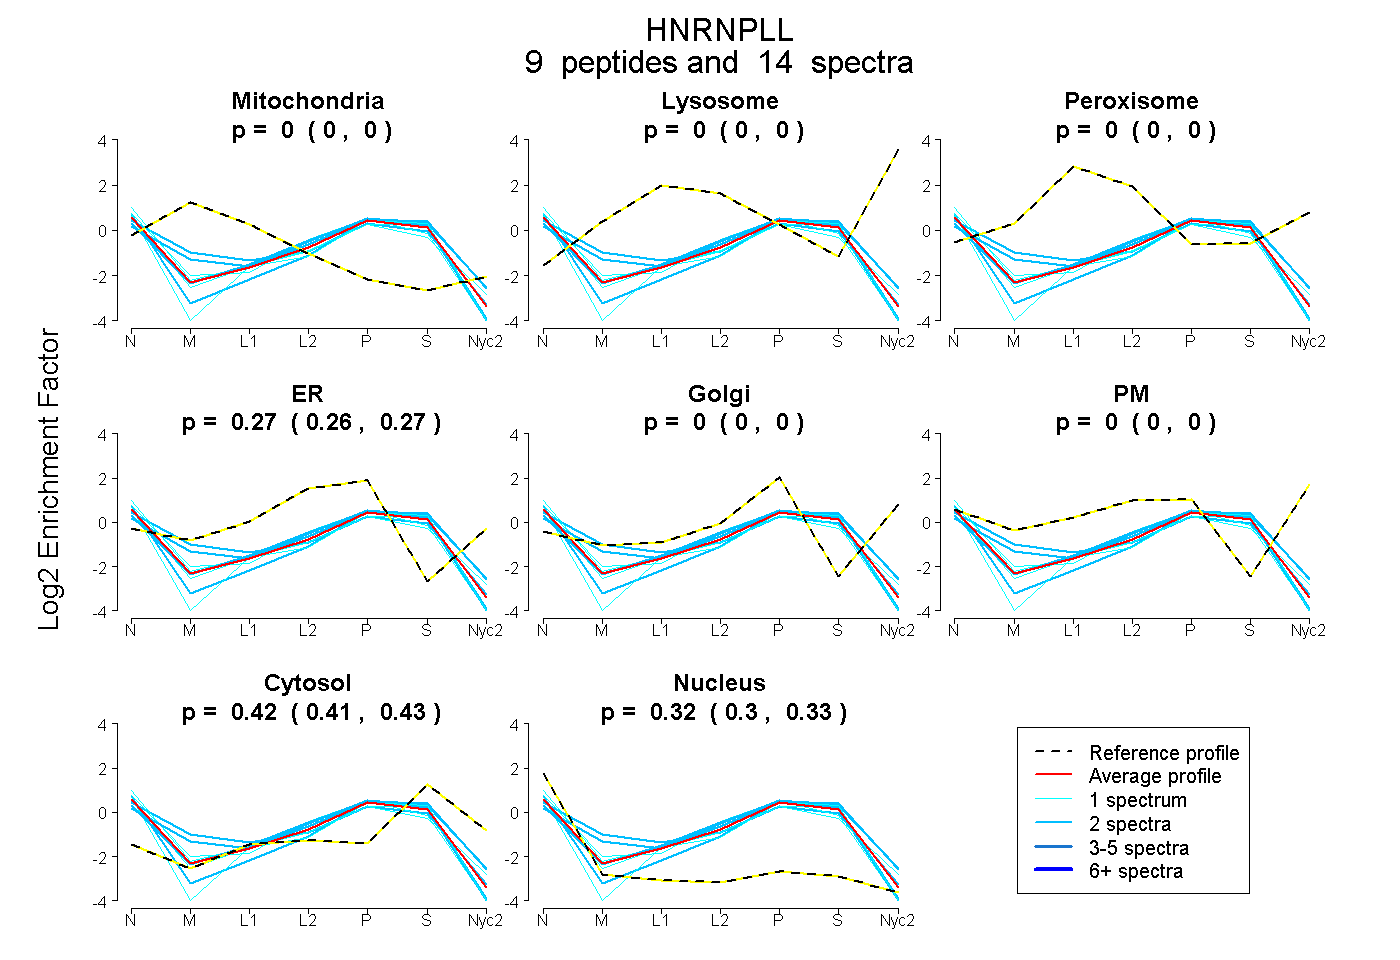
0.000 | 0.000
0.000 | 0.000
0.000 | 0.000
0.257 | 0.275
0.000 | 0.000
0.000 | 0.000
0.406 | 0.427
0.304 | 0.326
| Plot | Mito | Lyso | Perox | ER | Golgi | PM | Cytosol | Nucleus | |||||
| Expt A |
9 peptides |
14 spectra |
|
0.000 0.000 | 0.000 |
0.000 0.000 | 0.000 |
0.000 0.000 | 0.000 |
0.267 0.257 | 0.275 |
0.000 0.000 | 0.000 |
0.000 0.000 | 0.000 |
0.418 0.406 | 0.427 |
0.316 0.304 | 0.326 |
| 2 spectra, TDAVEALTALNHYQIR | 0.000 | 0.000 | 0.000 | 0.292 | 0.000 | 0.000 | 0.515 | 0.193 | ||
| 2 spectra, AVTHLNNVK | 0.087 | 0.000 | 0.000 | 0.284 | 0.000 | 0.000 | 0.363 | 0.266 | ||
| 1 spectrum, IVIFK | 0.000 | 0.000 | 0.000 | 0.304 | 0.000 | 0.000 | 0.340 | 0.356 | ||
| 2 spectra, GSGGDEGGSGGGPR | 0.000 | 0.000 | 0.000 | 0.170 | 0.000 | 0.000 | 0.411 | 0.419 | ||
| 1 spectrum, FTSAGQASK | 0.000 | 0.000 | 0.000 | 0.318 | 0.000 | 0.000 | 0.306 | 0.376 | ||
| 1 spectrum, GLCESVVEADLVEALEK | 0.000 | 0.000 | 0.000 | 0.204 | 0.000 | 0.000 | 0.436 | 0.360 | ||
| 1 spectrum, NDNDSWDYTKPYLGR | 0.000 | 0.000 | 0.000 | 0.137 | 0.000 | 0.000 | 0.473 | 0.390 | ||
| 2 spectra, LCNDHEVLPFIK | 0.000 | 0.000 | 0.000 | 0.264 | 0.000 | 0.000 | 0.407 | 0.329 | ||
| 2 spectra, LNVCVSK | 0.000 | 0.000 | 0.000 | 0.343 | 0.000 | 0.000 | 0.476 | 0.181 |
| Plot | Mito | Lyso or Perox | ER | Golgi | PM | Cytosol | Nucleus | ||||||
| Expt B |
3 peptides |
3 spectra |
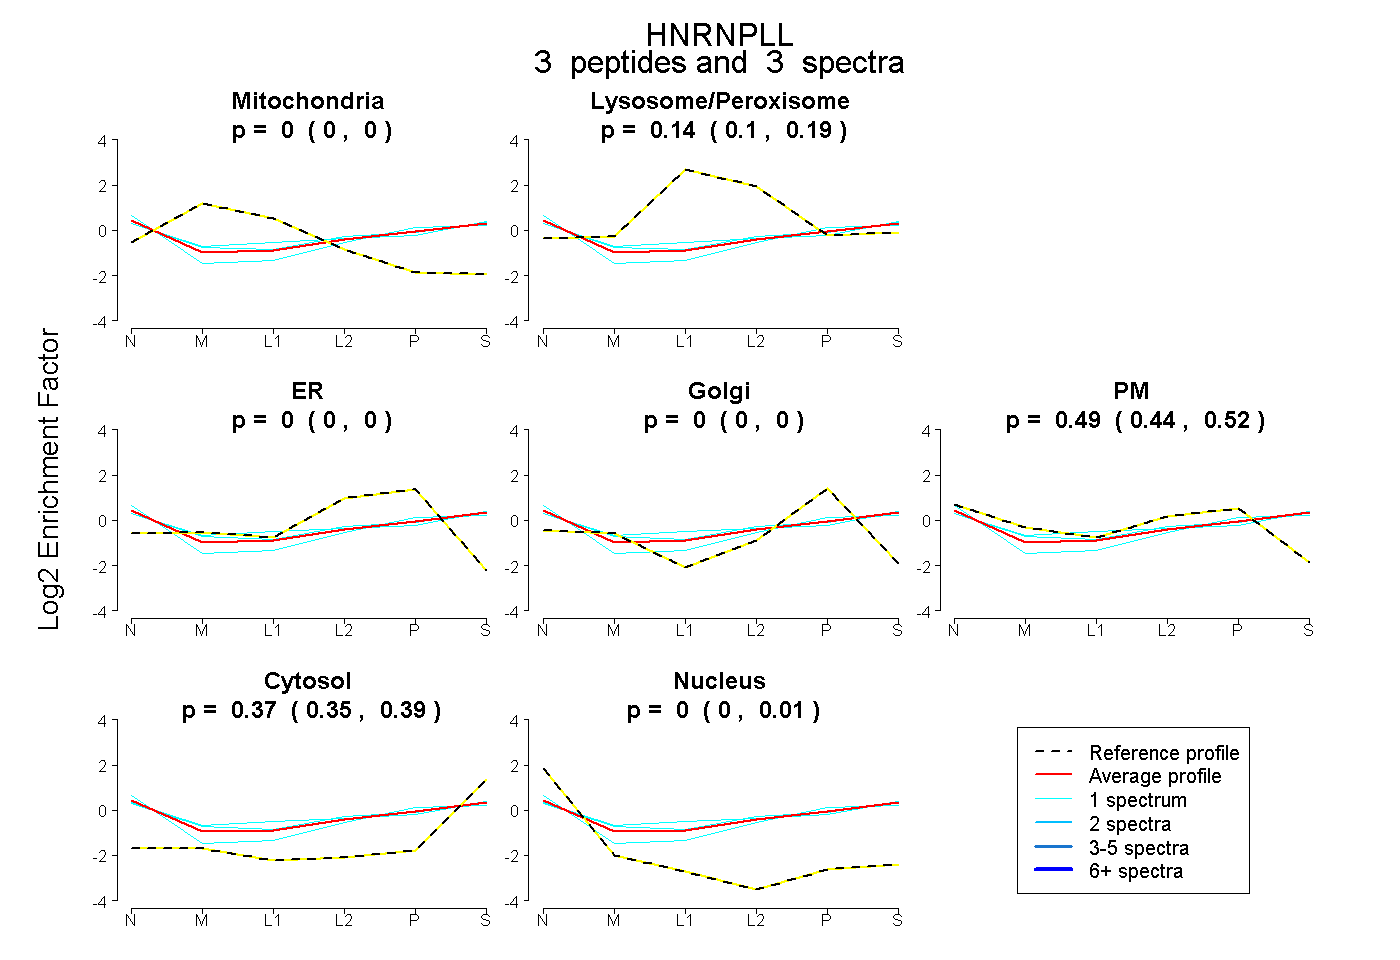 |
0.000 0.000 | 0.000 |
0.142 0.096 | 0.185 |
0.000 0.000 | 0.000 |
0.000 0.000 | 0.000 |
0.487 0.435 | 0.519 |
0.371 0.346 | 0.392 |
0.000 0.000 | 0.009 |
|||
| Plot | Lyso | Other | |||||||||||
| Expt C |
6 peptides |
19 spectra |
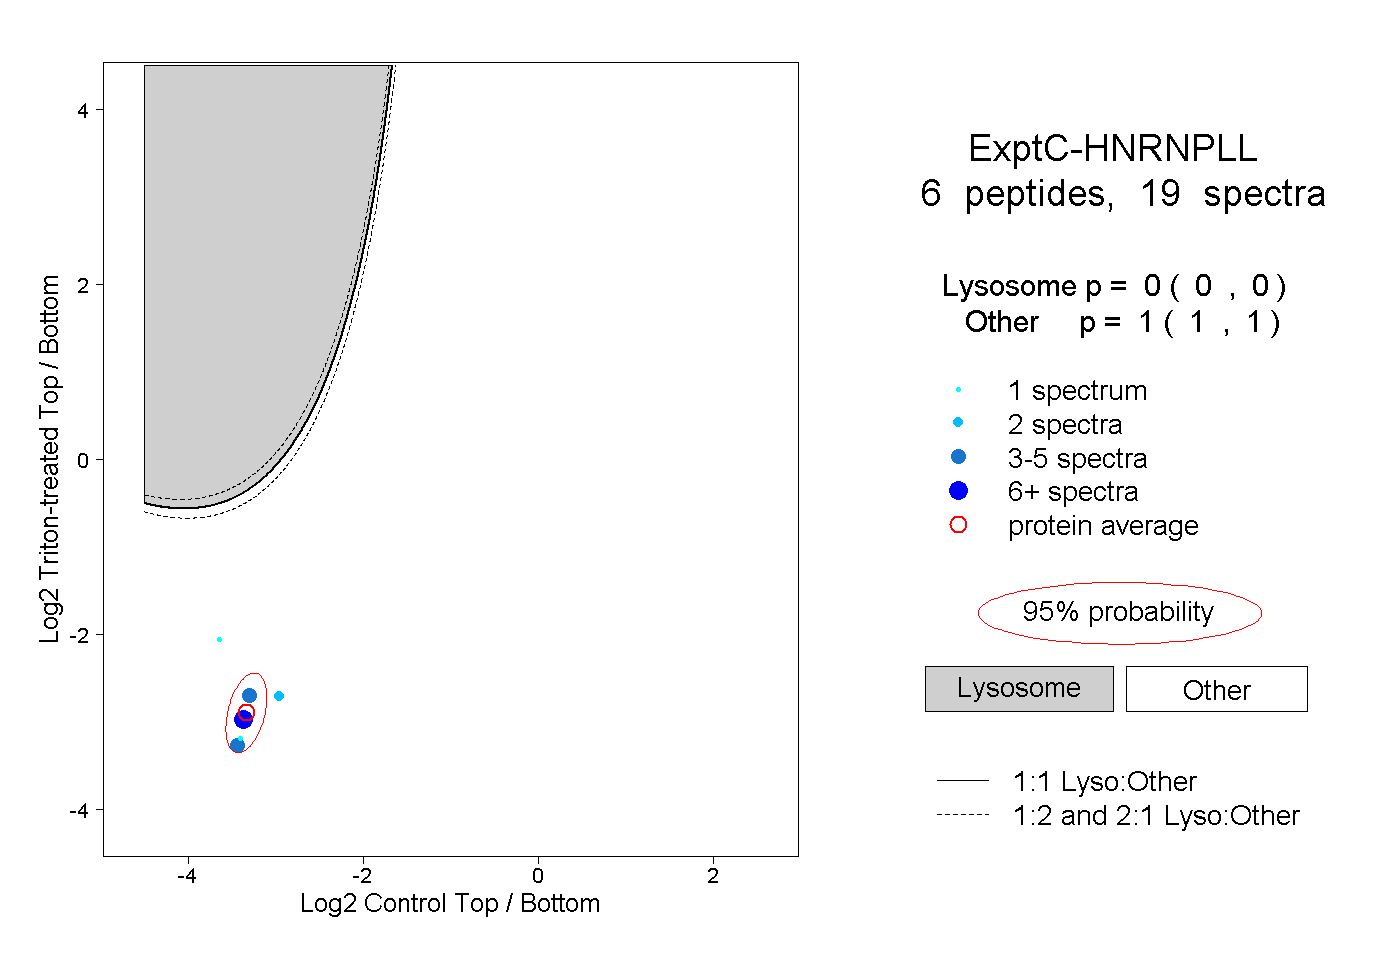 |
0.000 0.000 | 0.000 |
1.000 1.000 | 1.000 |
||||||||
| Plot | Lyso | Other | |||||||||||
| Expt D |
2 peptides |
2 spectra |
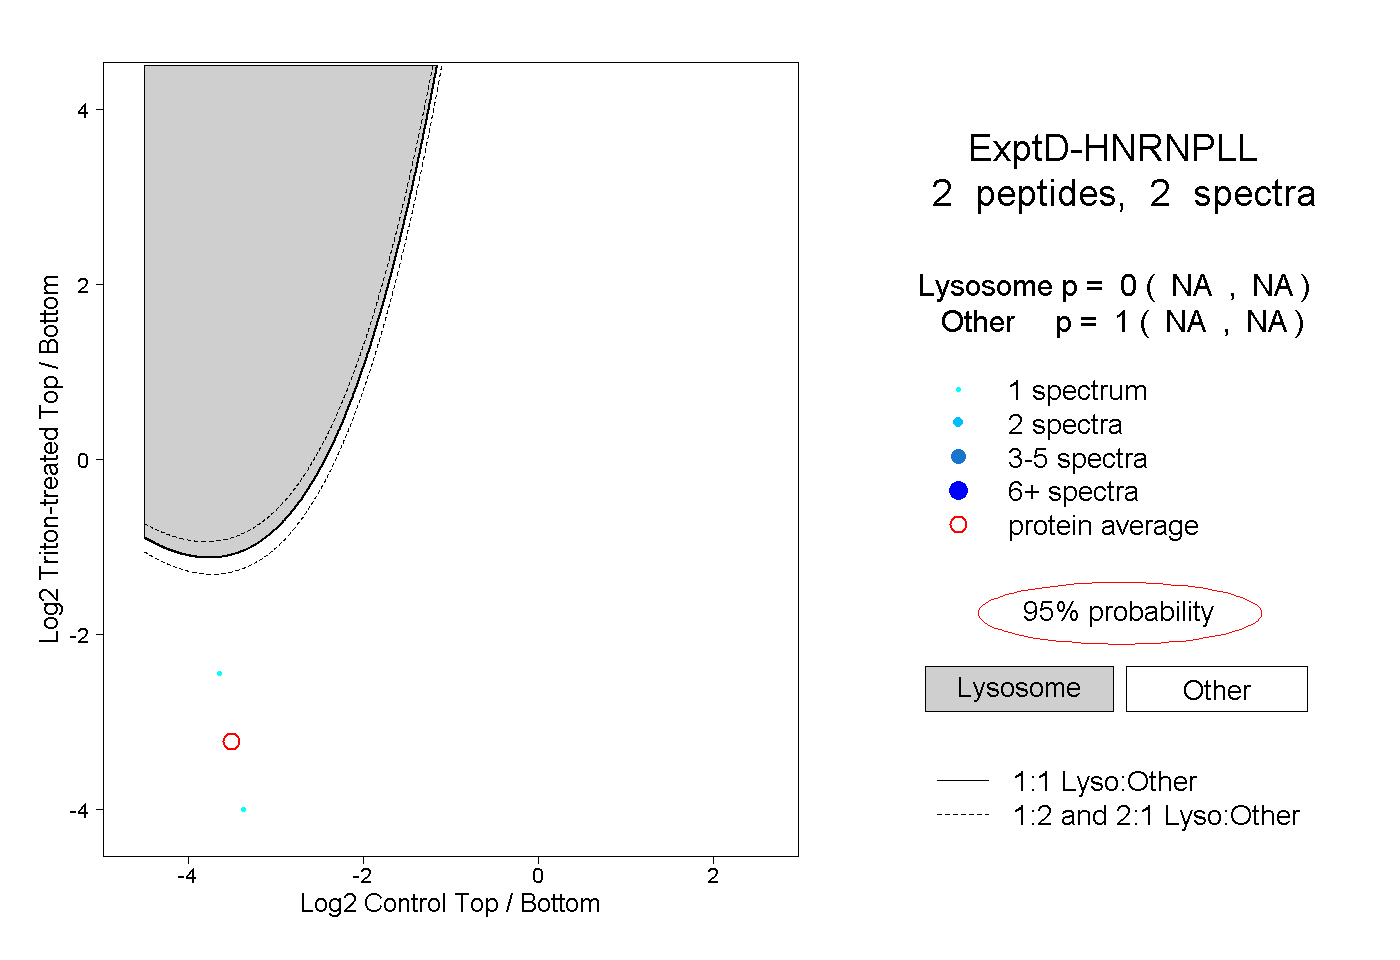 |
0.000 NA | NA |
1.000 NA | NA |