 6
6peptides
spectra
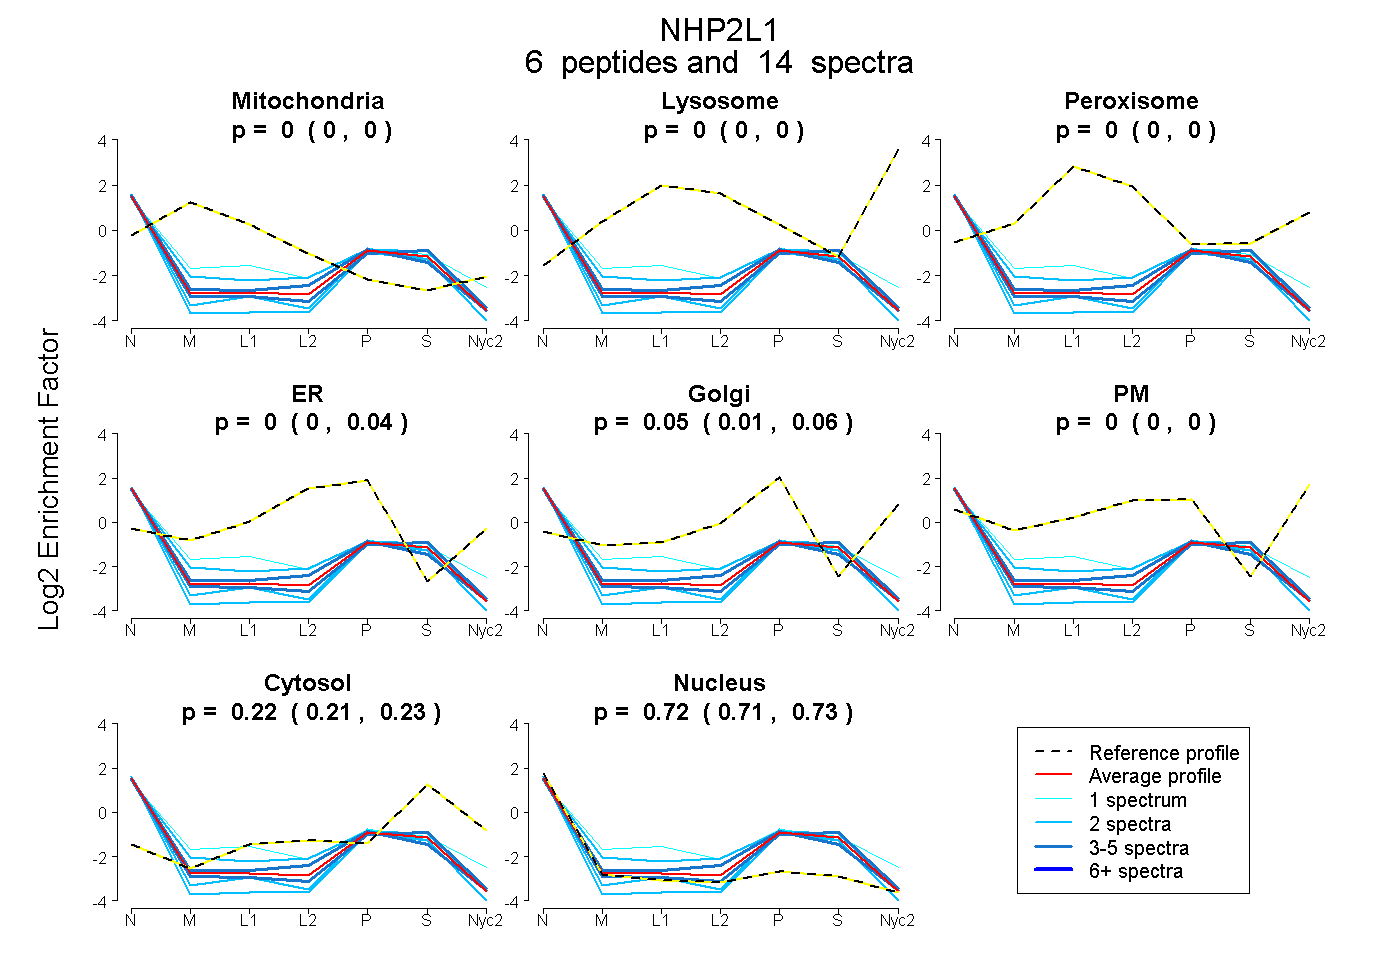
0.000 | 0.000
0.000 | 0.000
0.000 | 0.000
0.000 | 0.037
0.006 | 0.059
0.000 | 0.000
0.213 | 0.234
0.712 | 0.735
2peptides
spectra
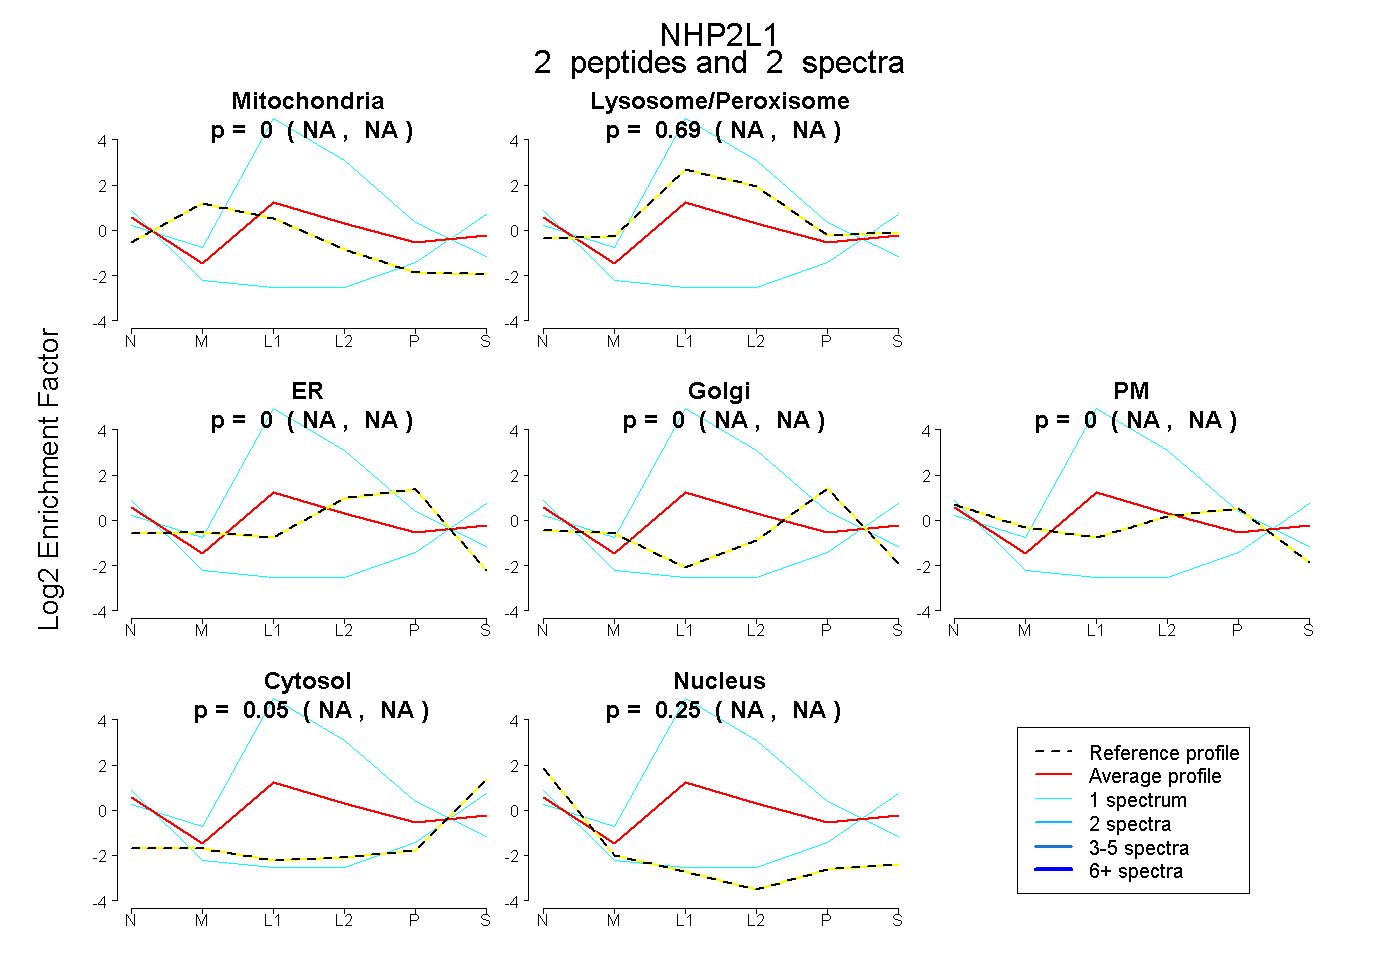
NA | NA
NA | NA
NA | NA
NA | NA
NA | NA
NA | NA
NA | NA
3peptides
spectra
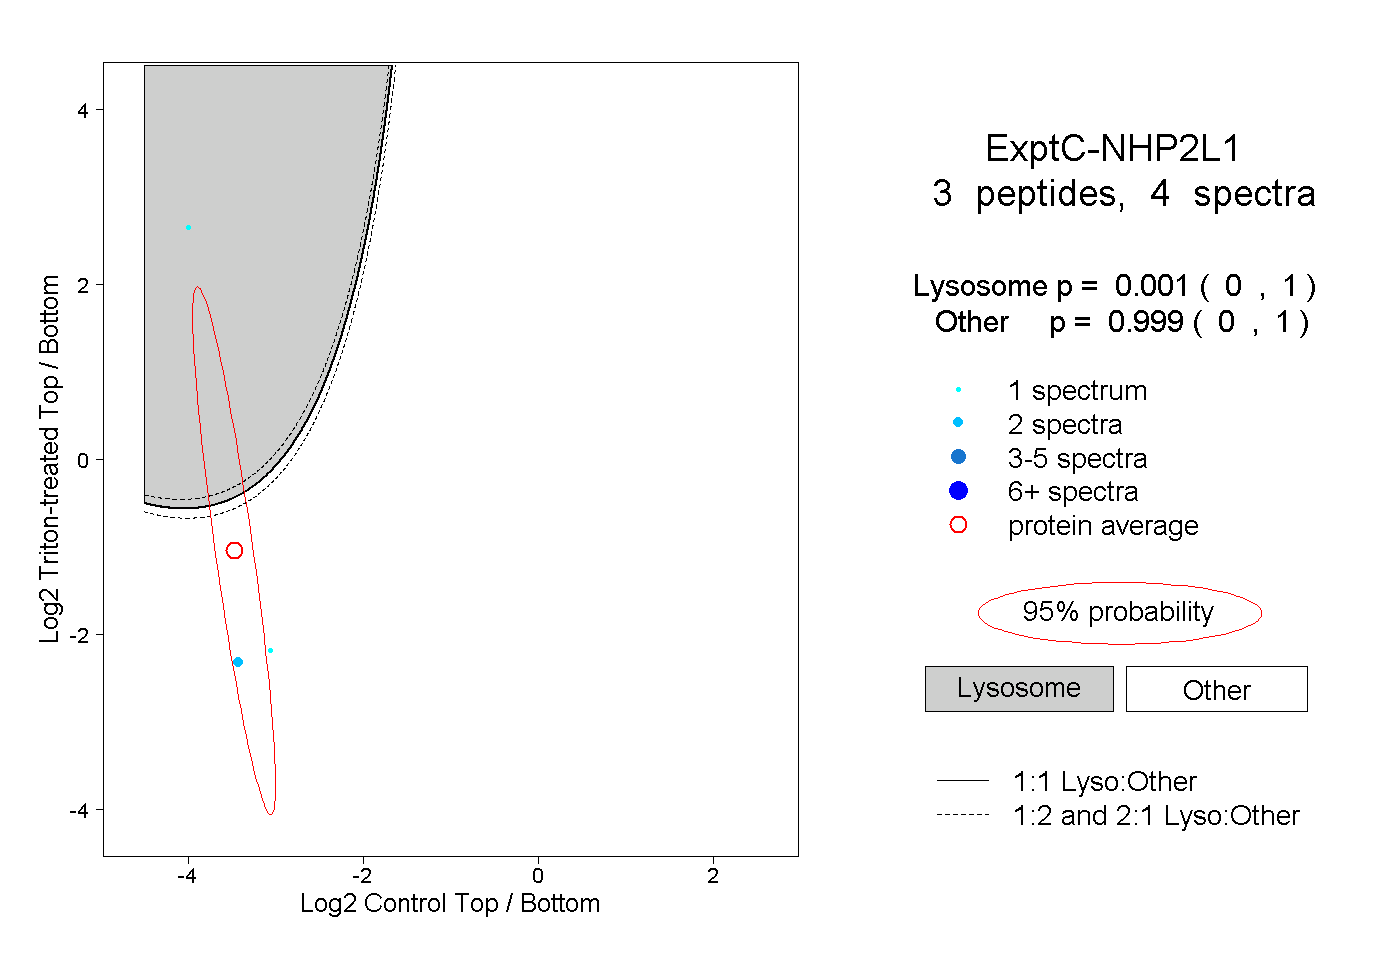
0.000 | 1.000
0.000 | 1.000