 6
6peptides
spectra
0.000 | 0.000
0.000 | 0.000
0.000 | 0.000
0.000 | 0.037
0.006 | 0.059
0.000 | 0.000
0.213 | 0.234
0.712 | 0.735
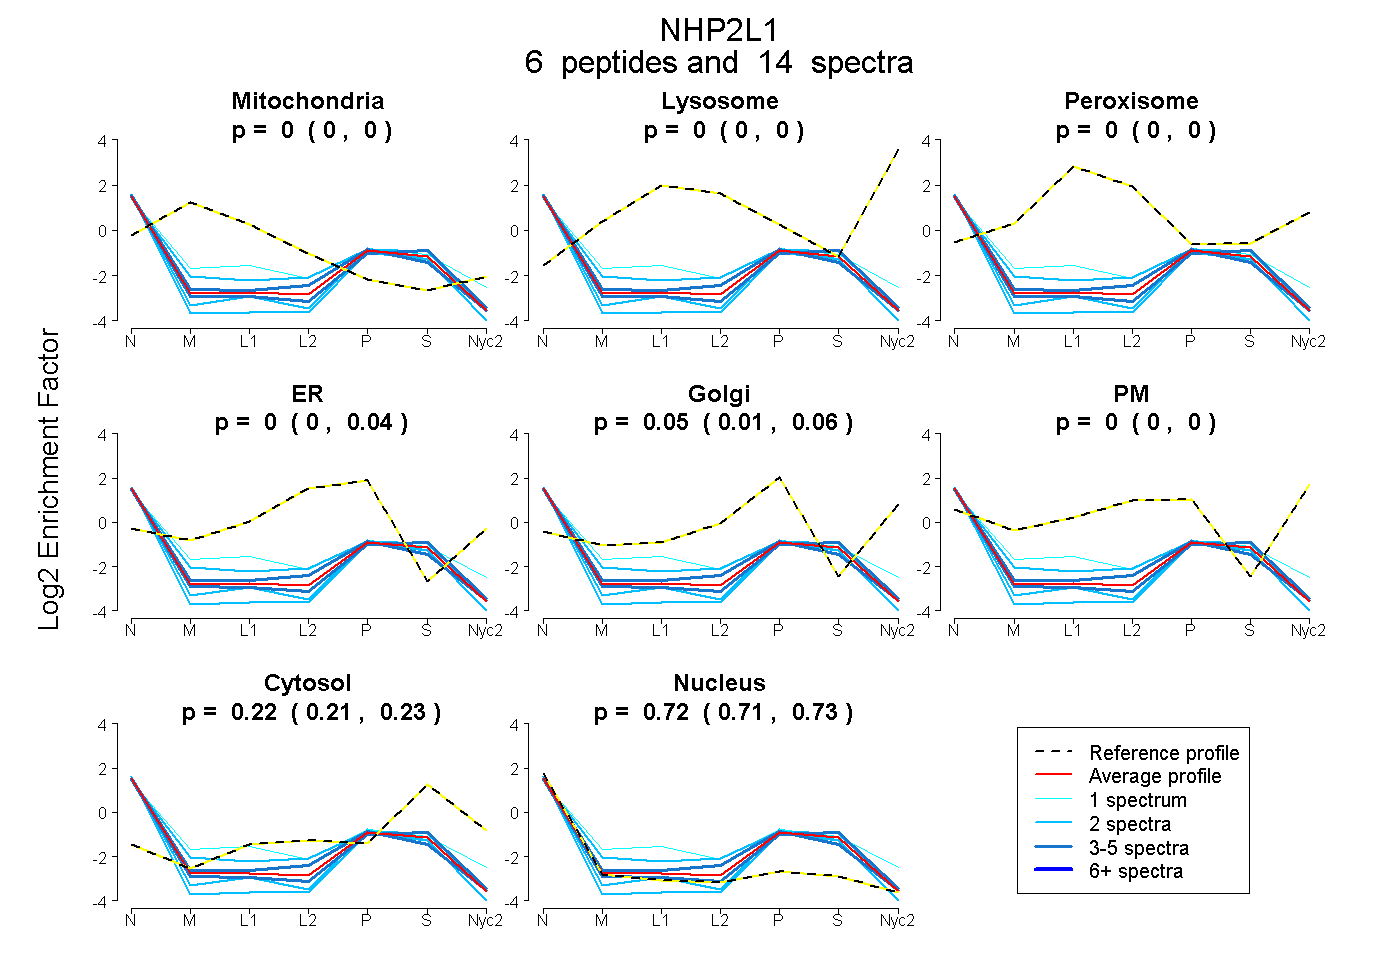
| Plot | Mito | Lyso | Perox | ER | Golgi | PM | Cytosol | Nucleus | |||||
| Expt A |
6 peptides |
14 spectra |
|
0.000 0.000 | 0.000 |
0.000 0.000 | 0.000 |
0.000 0.000 | 0.000 |
0.000 0.000 | 0.037 |
0.052 0.006 | 0.059 |
0.000 0.000 | 0.000 |
0.224 0.213 | 0.234 |
0.725 0.712 | 0.735 |
| 4 spectra, NVPYVFVR | 0.000 | 0.000 | 0.000 | 0.000 | 0.001 | 0.000 | 0.279 | 0.721 | ||
| 2 spectra, AYPLADAHLTK | 0.000 | 0.000 | 0.000 | 0.000 | 0.000 | 0.000 | 0.188 | 0.812 | ||
| 2 spectra, ACGVSRPVIACSVTIK | 0.000 | 0.000 | 0.000 | 0.000 | 0.000 | 0.000 | 0.148 | 0.852 | ||
| 1 spectrum, GANEATK | 0.000 | 0.000 | 0.116 | 0.038 | 0.105 | 0.000 | 0.175 | 0.566 | ||
| 3 spectra, QQIQSIQQSIER | 0.000 | 0.000 | 0.000 | 0.116 | 0.000 | 0.000 | 0.165 | 0.718 | ||
| 2 spectra, LLDLVQQSCNYK | 0.000 | 0.000 | 0.000 | 0.145 | 0.000 | 0.000 | 0.232 | 0.623 |
| Plot | Mito | Lyso or Perox | ER | Golgi | PM | Cytosol | Nucleus | ||||||
| Expt B |
2 peptides |
2 spectra |
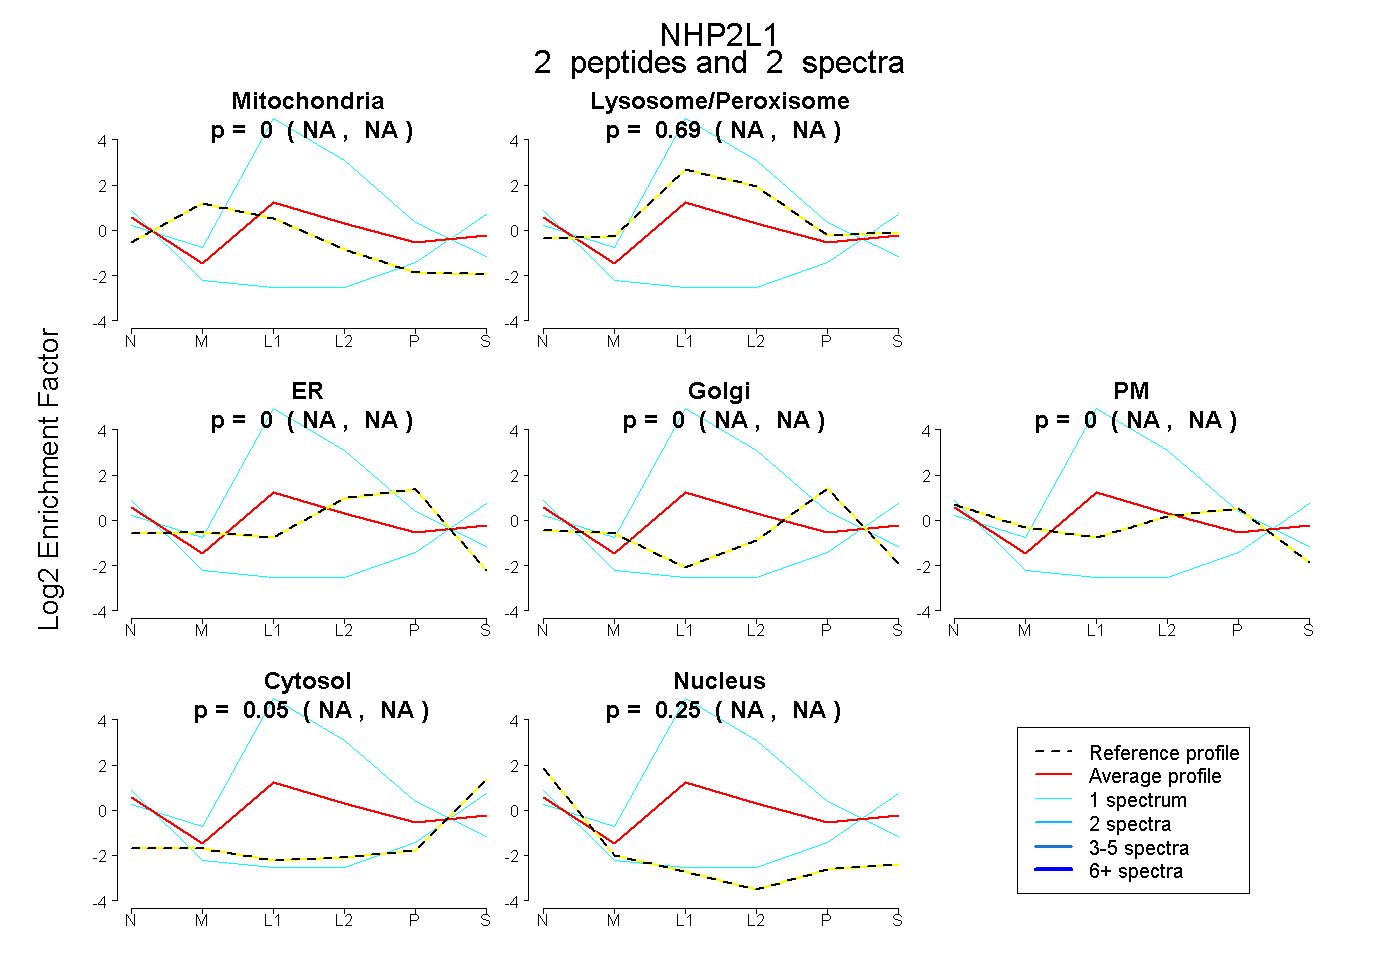 |
0.000 NA | NA |
0.694 NA | NA |
0.000 NA | NA |
0.000 NA | NA |
0.000 NA | NA |
0.053 NA | NA |
0.252 NA | NA |
|||
| Plot | Lyso | Other | |||||||||||
| Expt C |
3 peptides |
4 spectra |
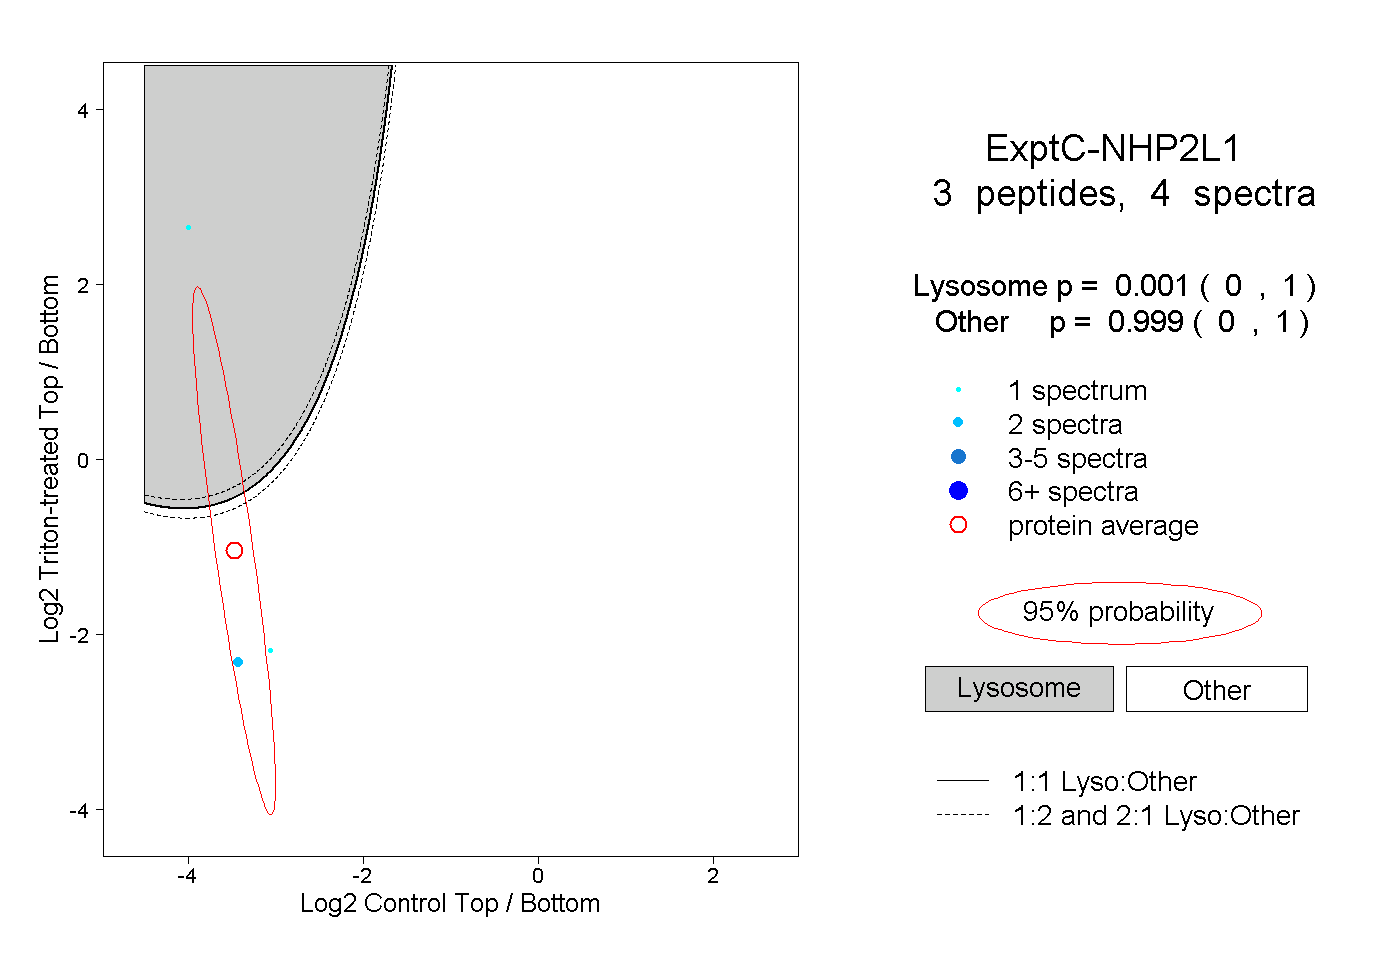 |
0.001 0.000 | 1.000 |
0.999 0.000 | 1.000 |