 11
11peptides
spectra
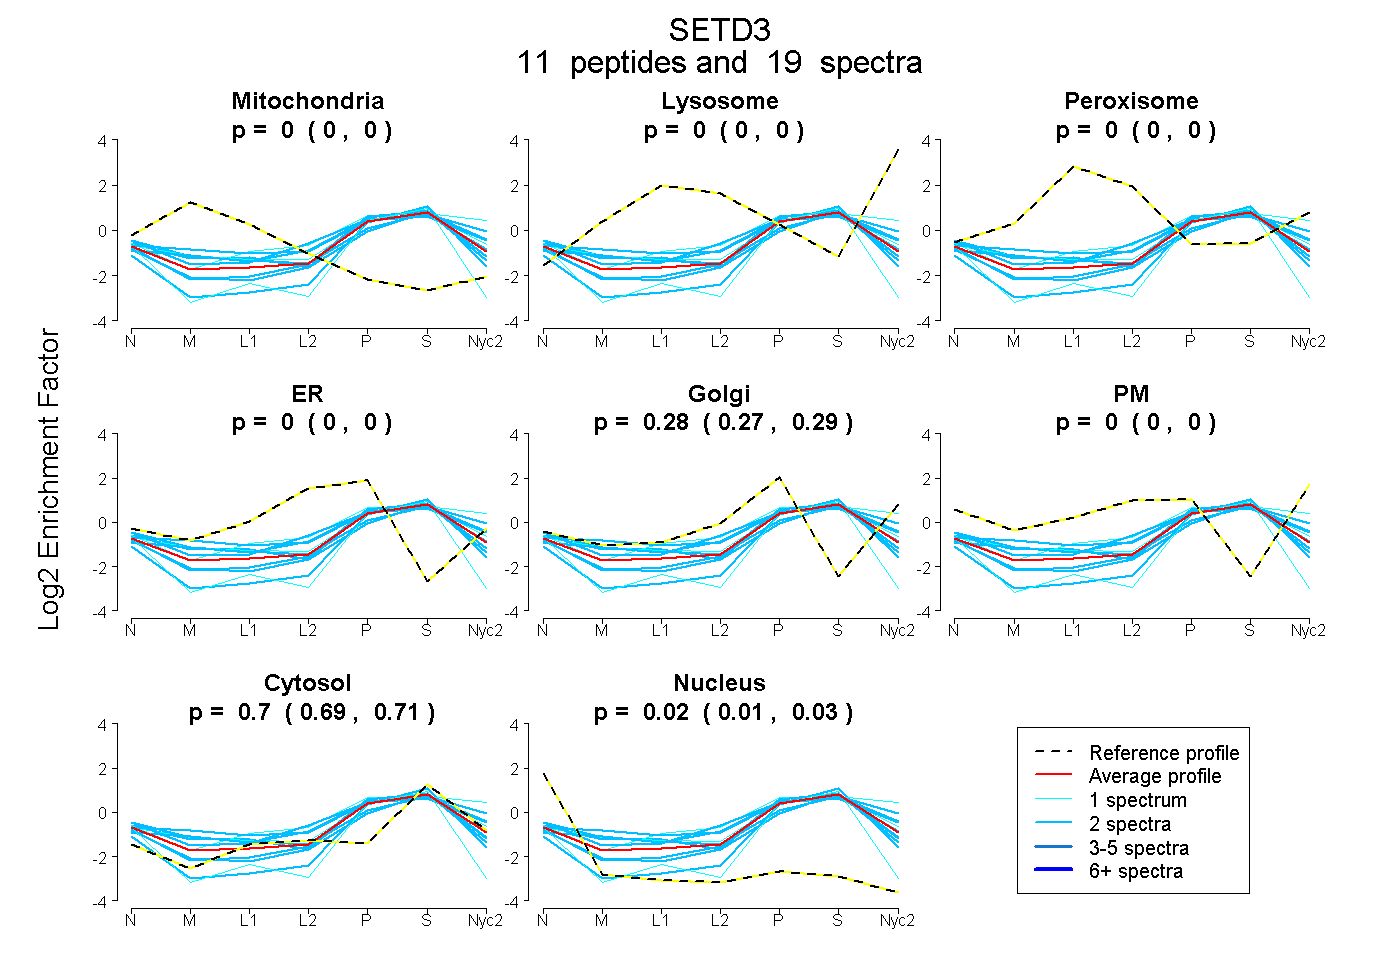
0.000 | 0.000
0.000 | 0.000
0.000 | 0.000
0.000 | 0.000
0.267 | 0.286
0.000 | 0.000
0.694 | 0.705
0.011 | 0.031
2peptides
spectra
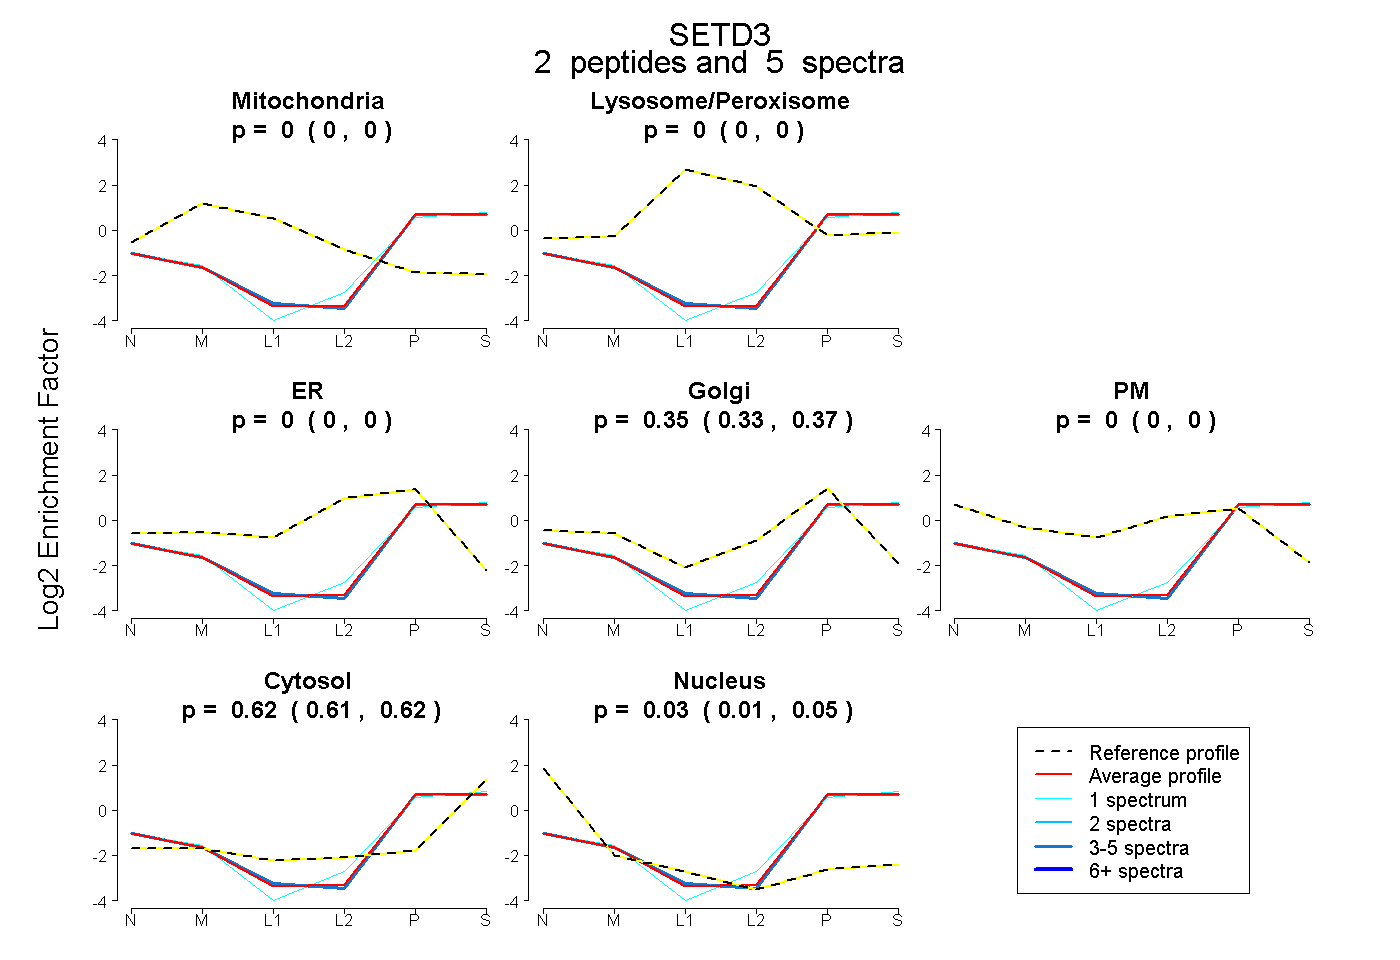
0.000 | 0.000
0.000 | 0.000
0.000 | 0.000
0.328 | 0.375
0.000 | 0.000
0.611 | 0.624
0.005 | 0.047
5peptides
spectra
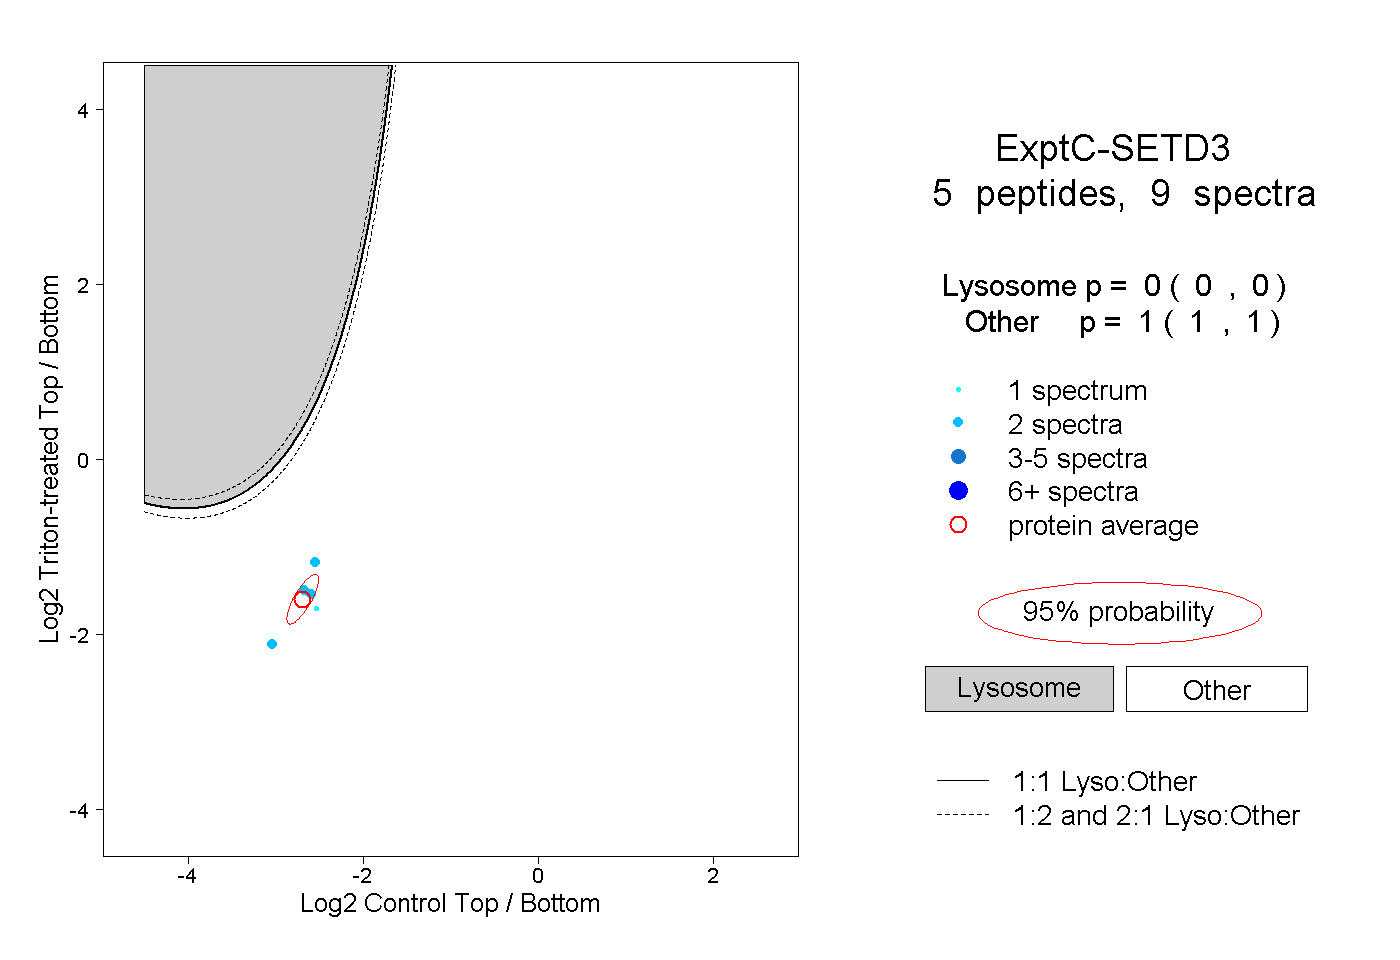
0.000 | 0.000
1.000 | 1.000
1peptide
spectrum
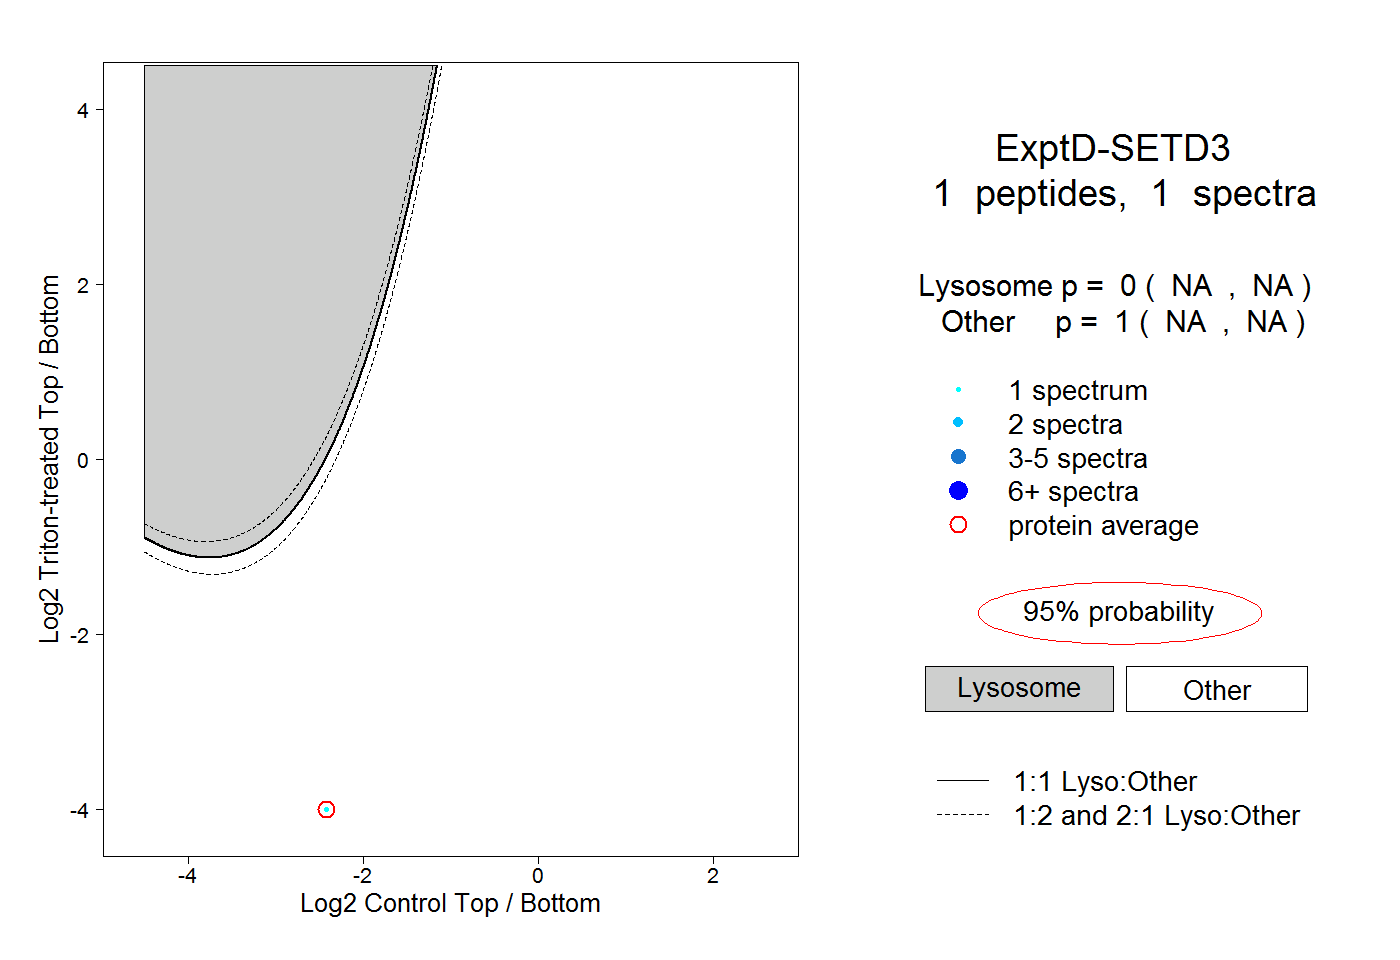
NA | NA
NA | NA