 11
11peptides
spectra
0.000 | 0.000
0.000 | 0.000
0.000 | 0.000
0.000 | 0.000
0.267 | 0.286
0.000 | 0.000
0.694 | 0.705
0.011 | 0.031
| Plot | Mito | Lyso | Perox | ER | Golgi | PM | Cytosol | Nucleus | |||||
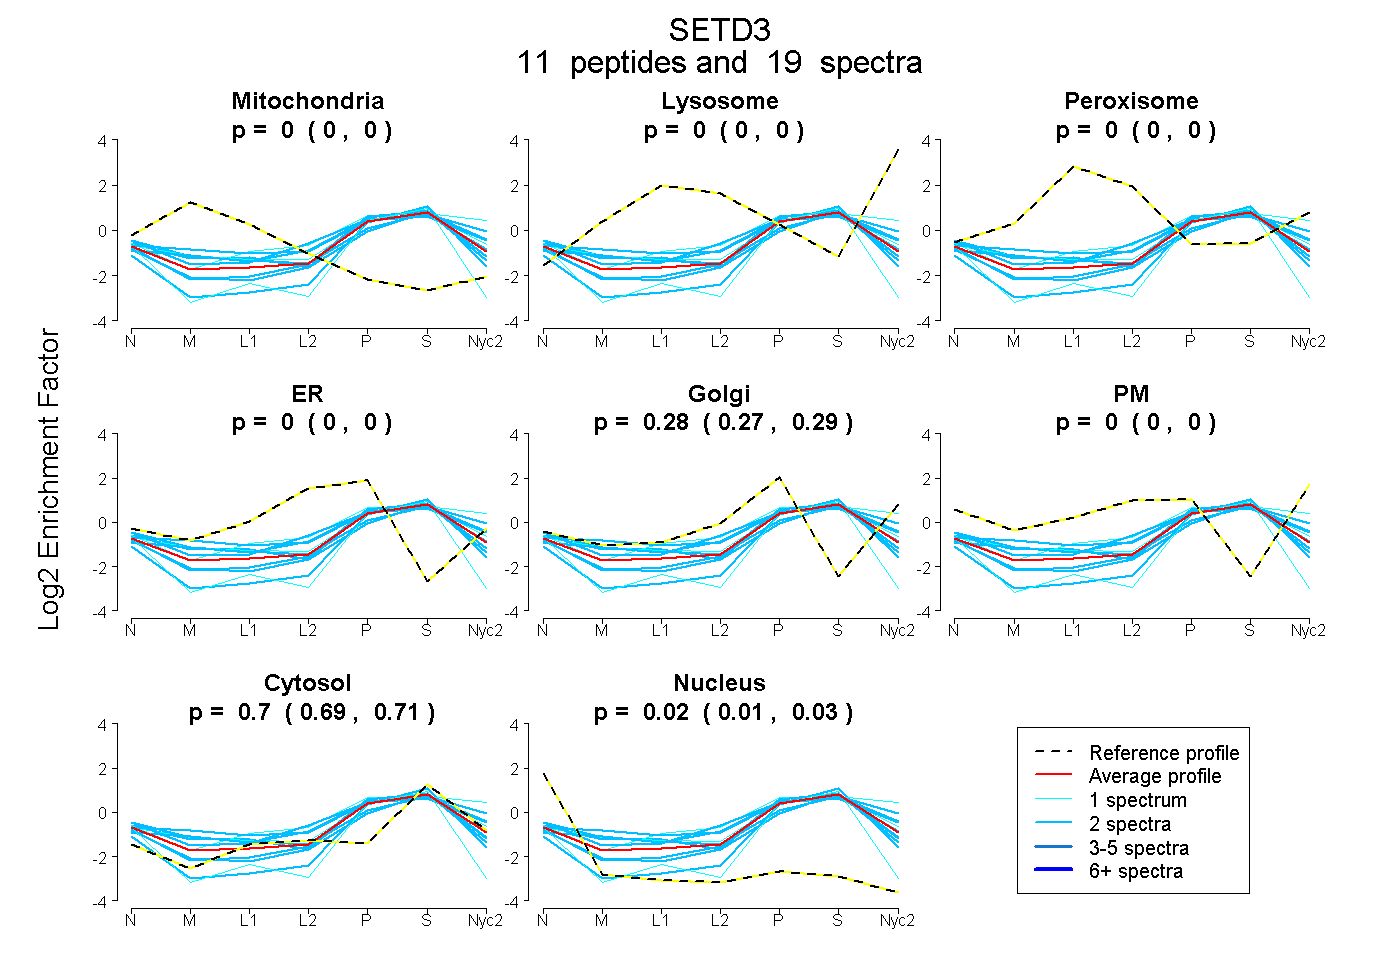
| Expt A |
11 peptides |
19 spectra |
|
0.000 0.000 | 0.000 |
0.000 0.000 | 0.000 |
0.000 0.000 | 0.000 |
0.000 0.000 | 0.000 |
0.277 0.267 | 0.286 |
0.000 0.000 | 0.000 |
0.700 0.694 | 0.705 |
0.022 0.011 | 0.031 |
| 1 spectrum, YEESDLGLLEGGVGDSR | 0.000 | 0.000 | 0.000 | 0.000 | 0.000 | 0.000 | 0.719 | 0.281 | ||
| 2 spectra, VIQTHPHANK | 0.000 | 0.042 | 0.000 | 0.000 | 0.352 | 0.000 | 0.606 | 0.000 | ||
| 2 spectra, AEELFLWVPR | 0.000 | 0.000 | 0.000 | 0.000 | 0.069 | 0.000 | 0.799 | 0.132 | ||
| 2 spectra, QYAYFYK | 0.030 | 0.000 | 0.069 | 0.000 | 0.333 | 0.000 | 0.568 | 0.000 | ||
| 2 spectra, QNQIPTEDGSR | 0.000 | 0.000 | 0.000 | 0.000 | 0.232 | 0.000 | 0.707 | 0.061 | ||
| 2 spectra, AEVLAR | 0.100 | 0.000 | 0.000 | 0.000 | 0.186 | 0.000 | 0.702 | 0.012 | ||
| 1 spectrum, ATMAIK | 0.000 | 0.000 | 0.000 | 0.173 | 0.198 | 0.000 | 0.630 | 0.000 | ||
| 1 spectrum, IFTLGNSEFPVSWDNEVK | 0.000 | 0.073 | 0.000 | 0.000 | 0.325 | 0.000 | 0.602 | 0.000 | ||
| 2 spectra, GLSVTFDGK | 0.048 | 0.000 | 0.000 | 0.000 | 0.296 | 0.000 | 0.656 | 0.000 | ||
| 2 spectra, WAVSSVMTR | 0.000 | 0.000 | 0.000 | 0.000 | 0.232 | 0.000 | 0.711 | 0.058 | ||
| 2 spectra, SAAMNR | 0.000 | 0.000 | 0.000 | 0.174 | 0.173 | 0.000 | 0.653 | 0.000 |
| Plot | Mito | Lyso or Perox | ER | Golgi | PM | Cytosol | Nucleus | ||||||
| Expt B |
2 peptides |
5 spectra |
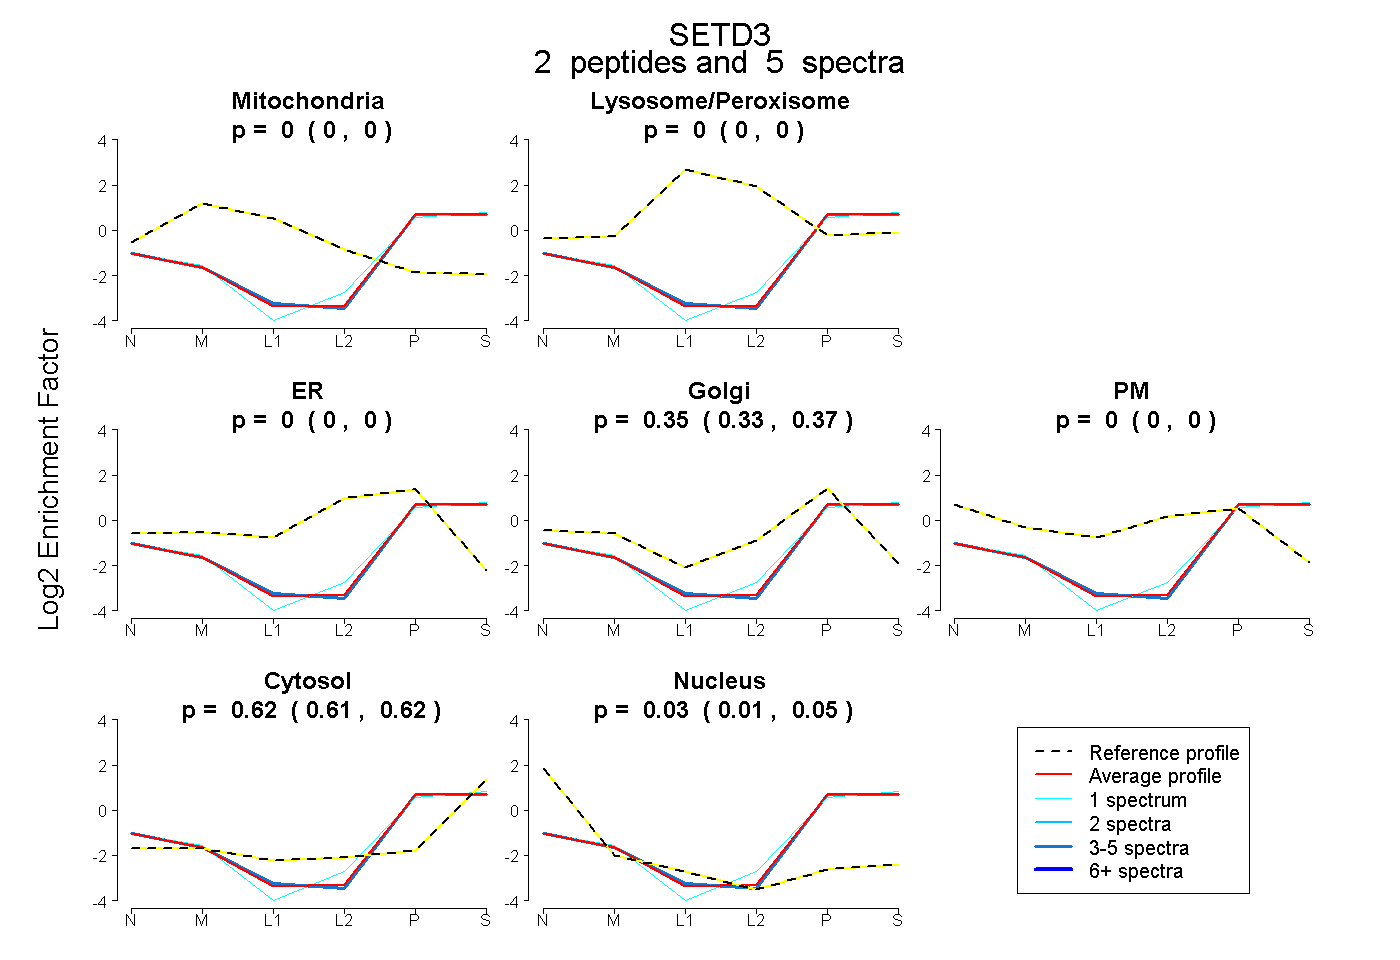 |
0.000 0.000 | 0.000 |
0.000 0.000 | 0.000 |
0.000 0.000 | 0.000 |
0.354 0.328 | 0.375 |
0.000 0.000 | 0.000 |
0.618 0.611 | 0.624 |
0.028 0.005 | 0.047 |
|||
| Plot | Lyso | Other | |||||||||||
| Expt C |
5 peptides |
9 spectra |
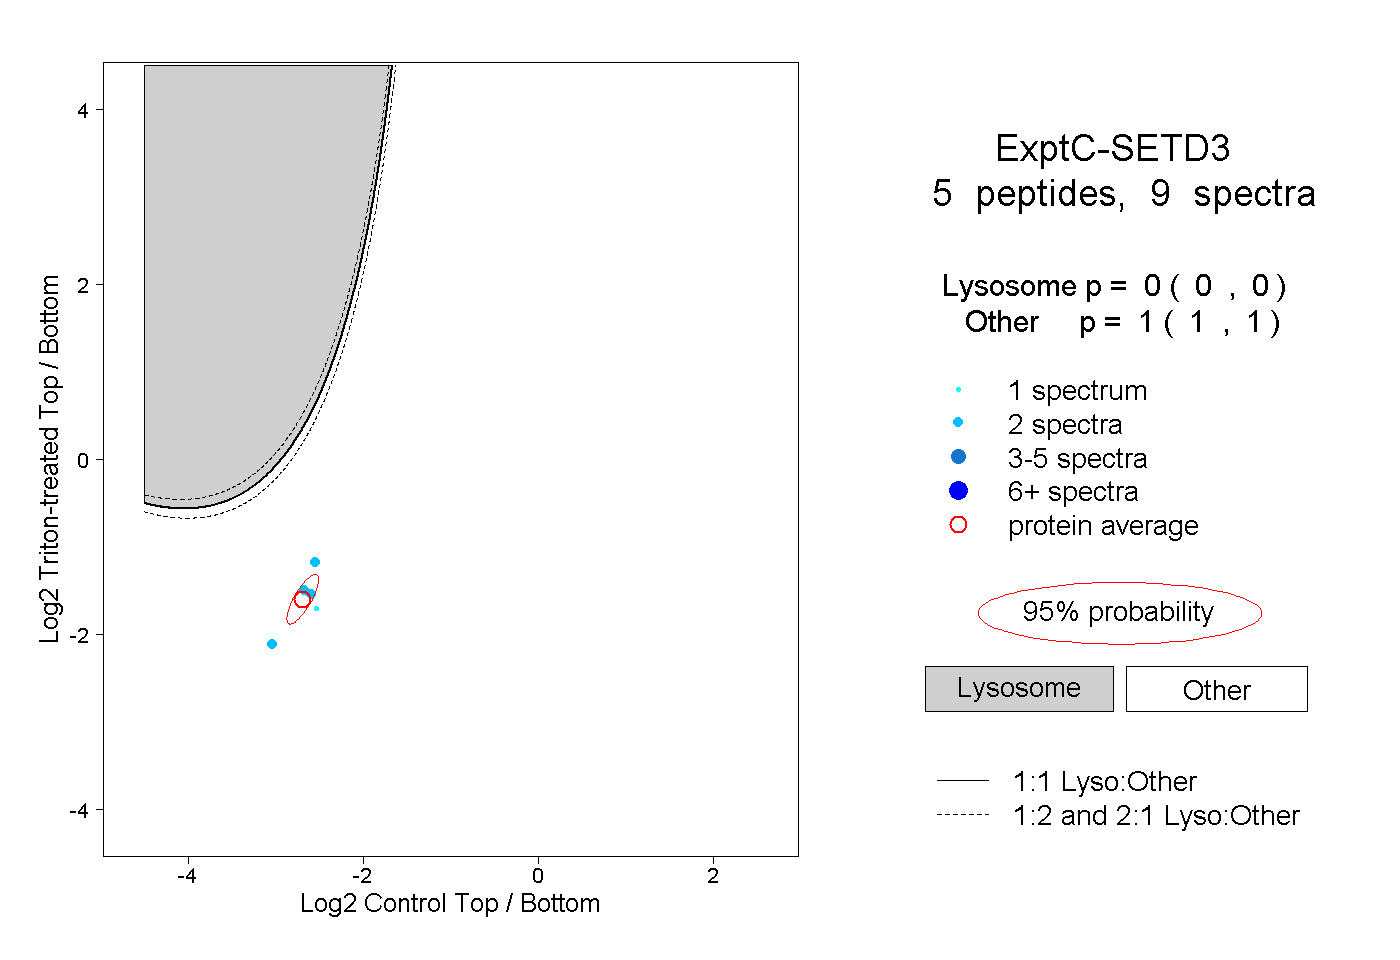 |
0.000 0.000 | 0.000 |
1.000 1.000 | 1.000 |
||||||||
| Plot | Lyso | Other | |||||||||||
| Expt D |
1 peptide |
1 spectrum |
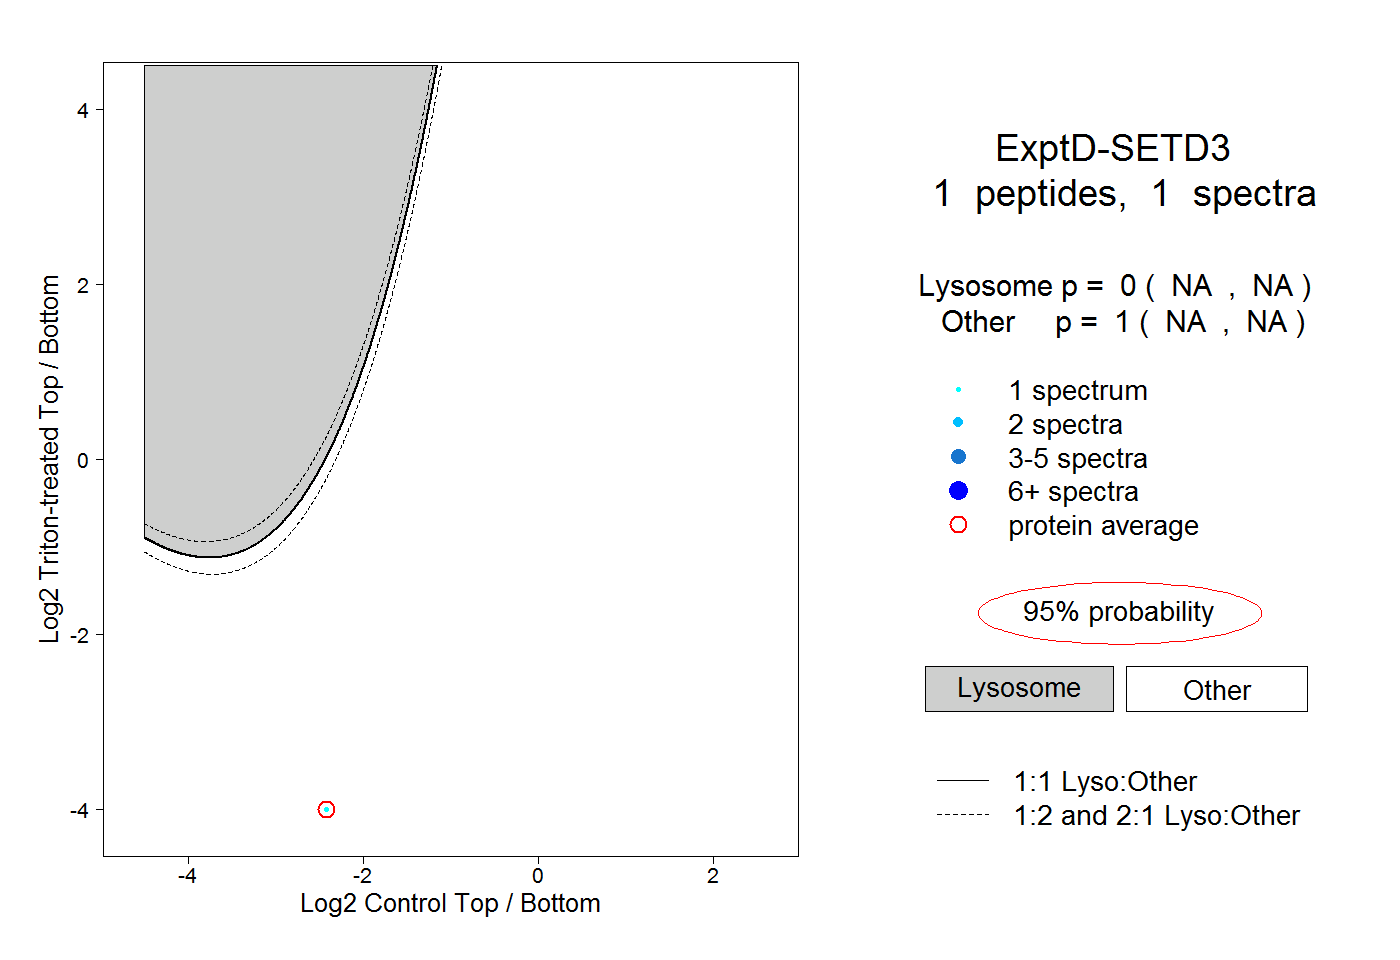 |
0.000 NA | NA |
1.000 NA | NA |