 6
6peptides
spectra
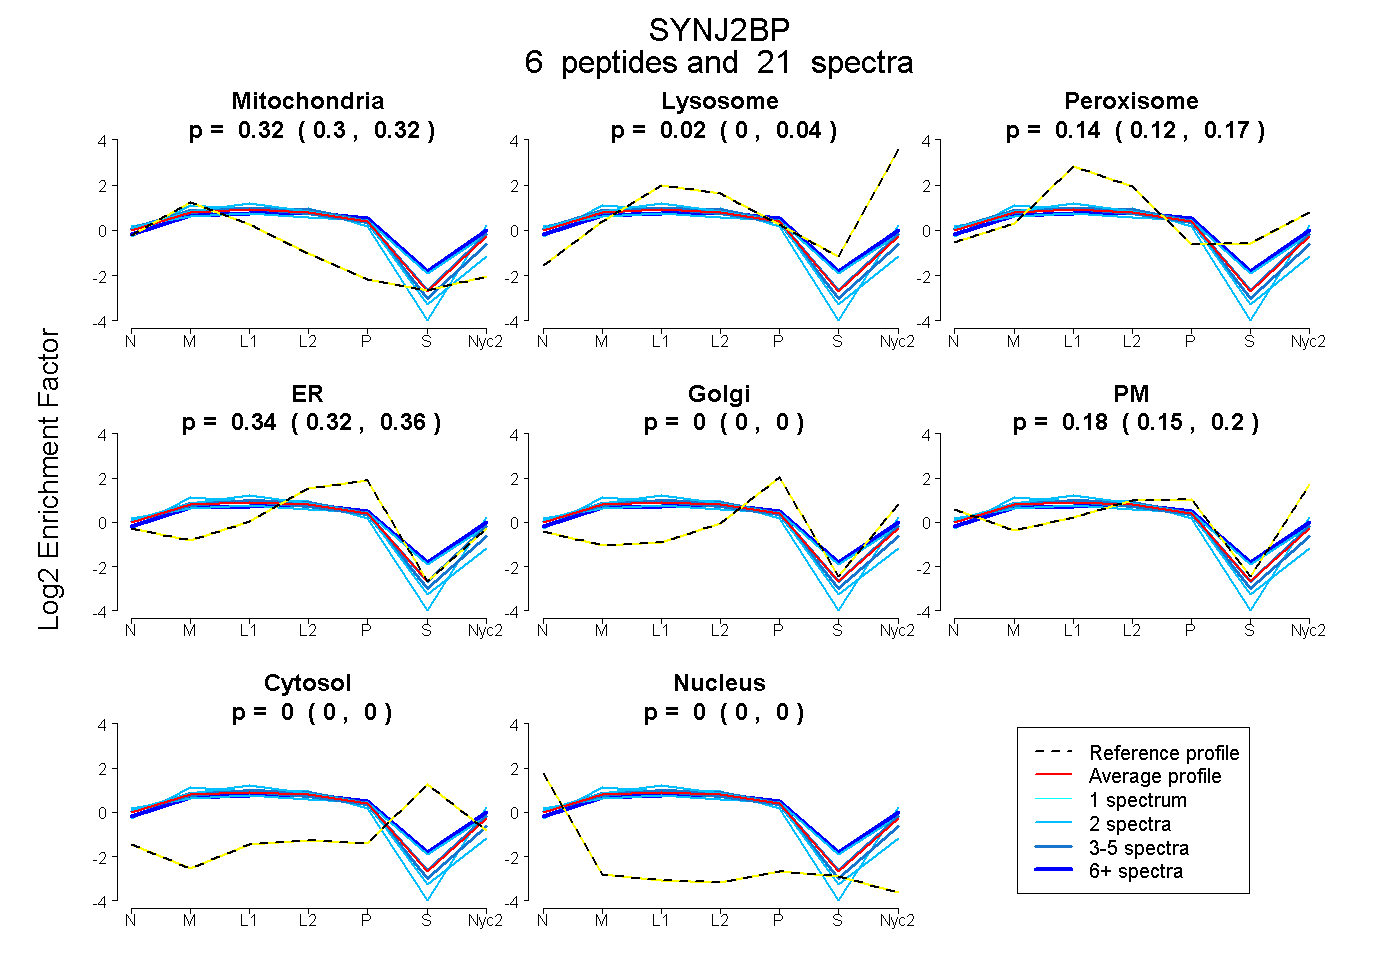
0.305 | 0.323
0.000 | 0.036
0.116 | 0.168
0.323 | 0.360
0.000 | 0.000
0.155 | 0.198
0.000 | 0.000
0.000 | 0.000
3peptides
spectra
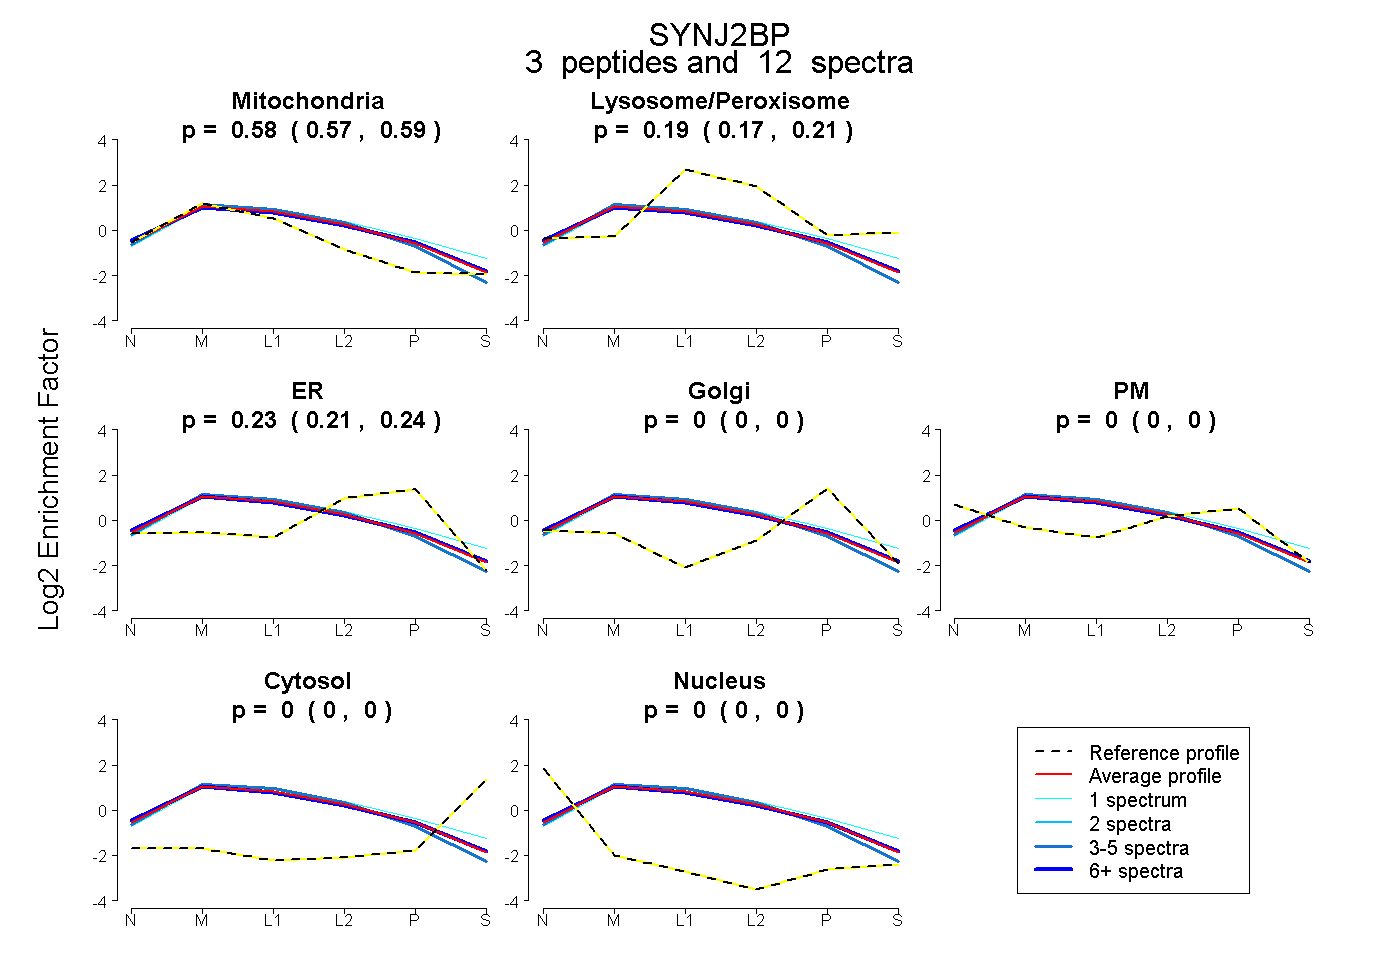
0.566 | 0.591
0.174 | 0.213
0.209 | 0.238
0.000 | 0.000
0.000 | 0.000
0.000 | 0.000
0.000 | 0.000
5peptides
spectra
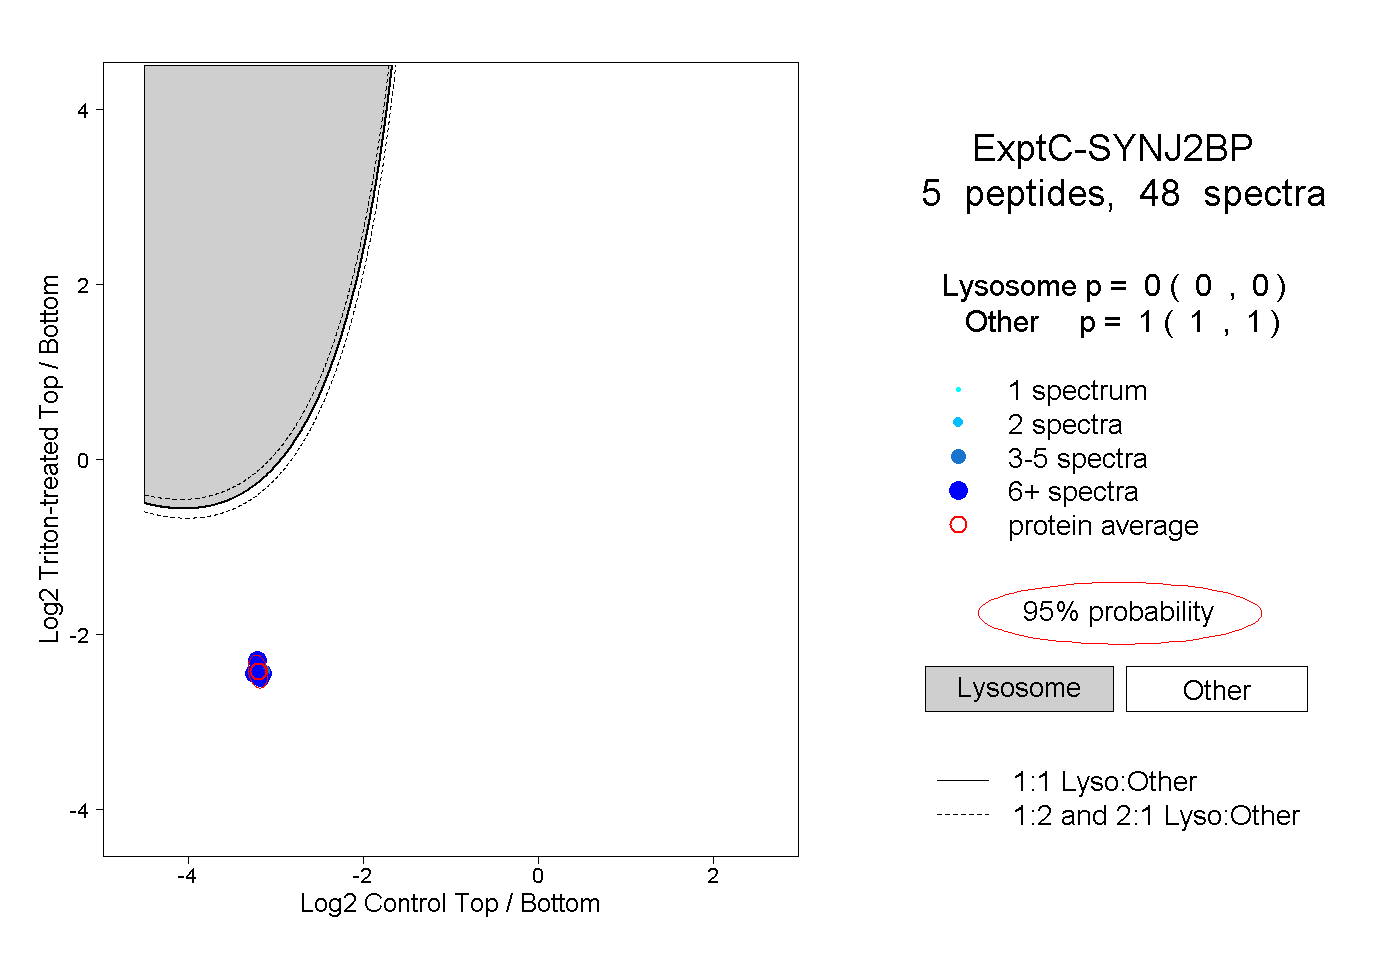
0.000 | 0.000
1.000 | 1.000
4peptides
spectra
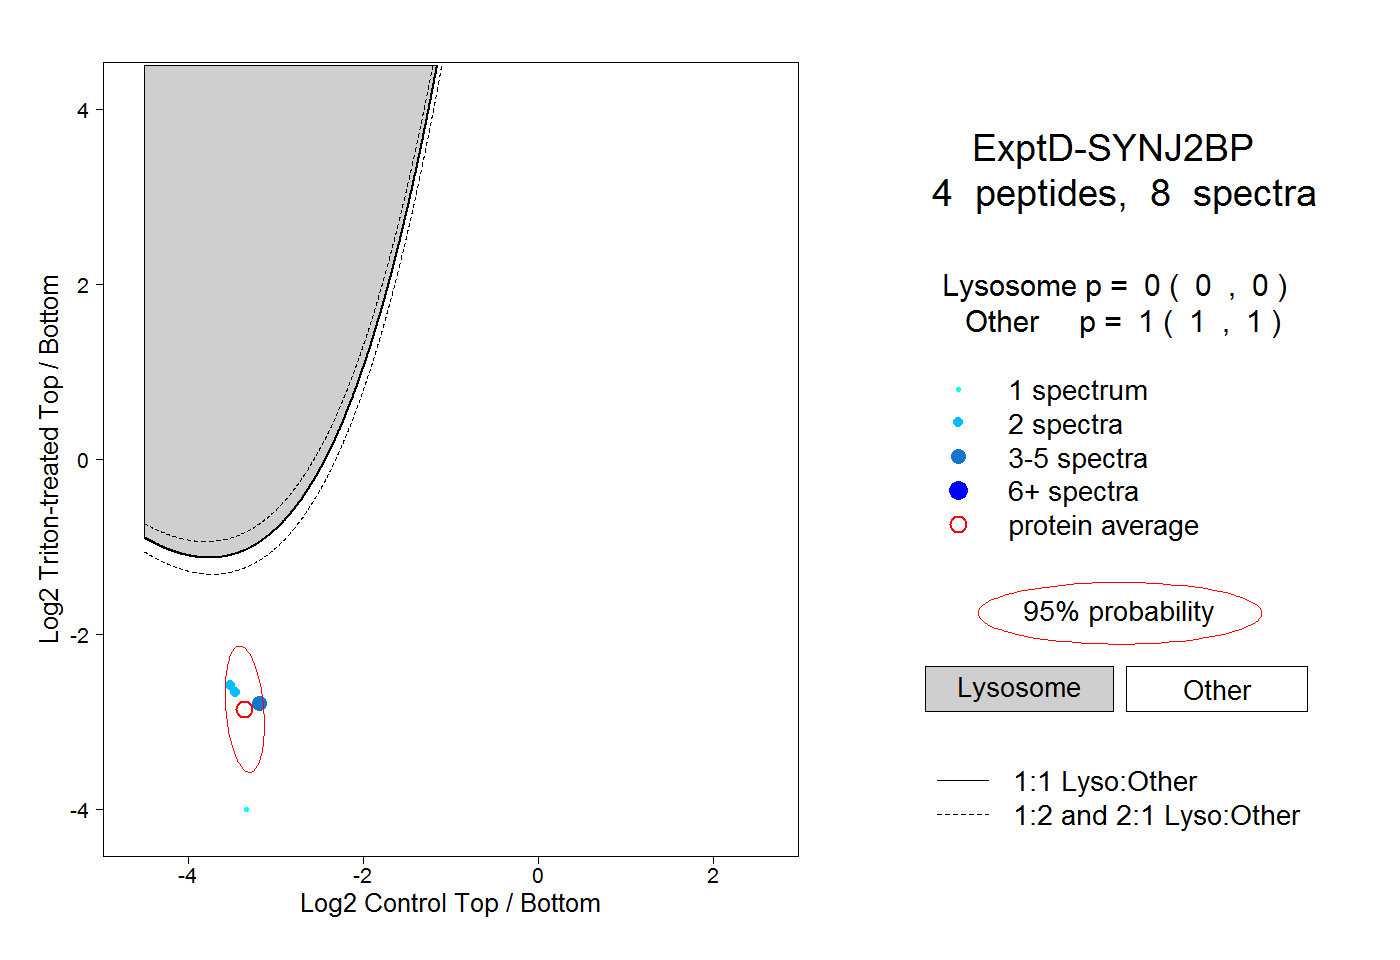
0.000 | 0.000
1.000 | 1.000