 6
6peptides
spectra
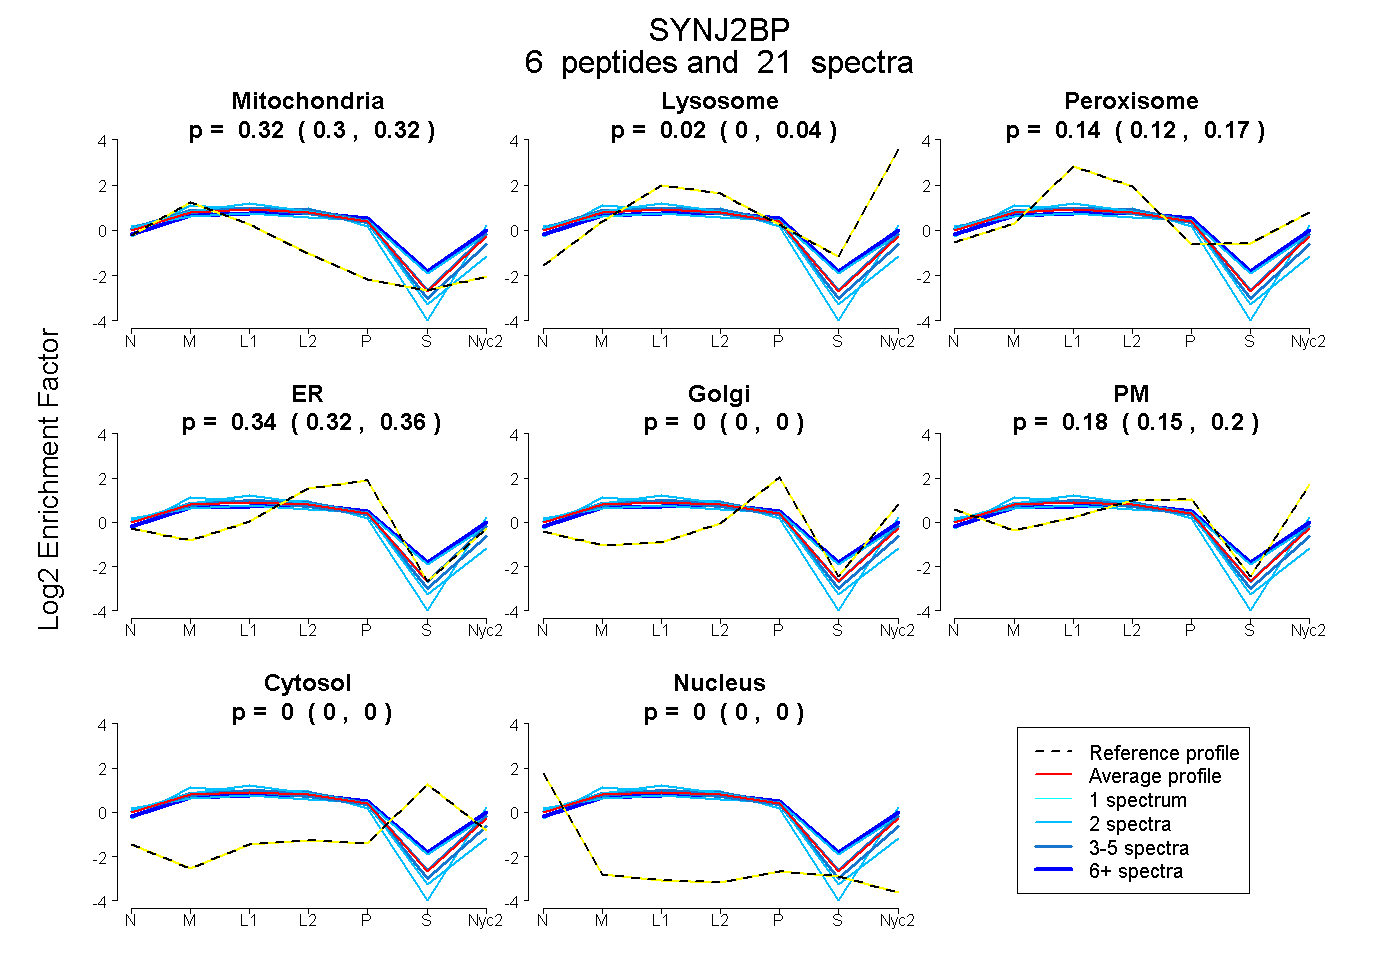
0.305 | 0.323
0.000 | 0.036
0.116 | 0.168
0.323 | 0.360
0.000 | 0.000
0.155 | 0.198
0.000 | 0.000
0.000 | 0.000
| Plot | Mito | Lyso | Perox | ER | Golgi | PM | Cytosol | Nucleus | |||||
| Expt A |
6 peptides |
21 spectra |
|
0.315 0.305 | 0.323 |
0.019 0.000 | 0.036 |
0.145 0.116 | 0.168 |
0.343 0.323 | 0.360 |
0.000 0.000 | 0.000 |
0.178 0.155 | 0.198 |
0.000 0.000 | 0.000 |
0.000 0.000 | 0.000 |
| 7 spectra, LPVQNGPIVHR | 0.241 | 0.049 | 0.235 | 0.280 | 0.064 | 0.132 | 0.000 | 0.000 | ||
| 2 spectra, ILSVNGQDLK | 0.357 | 0.139 | 0.000 | 0.271 | 0.000 | 0.233 | 0.000 | 0.000 | ||
| 4 spectra, NAGYAVSLR | 0.369 | 0.000 | 0.116 | 0.399 | 0.000 | 0.117 | 0.000 | 0.000 | ||
| 2 spectra, VDYLVSEEEINLTR | 0.394 | 0.000 | 0.104 | 0.501 | 0.000 | 0.000 | 0.000 | 0.000 | ||
| 4 spectra, NLLHQDAVDLFR | 0.283 | 0.000 | 0.182 | 0.314 | 0.000 | 0.222 | 0.000 | 0.000 | ||
| 2 spectra, LQEGDK | 0.289 | 0.000 | 0.201 | 0.254 | 0.012 | 0.244 | 0.000 | 0.000 |
| Plot | Mito | Lyso or Perox | ER | Golgi | PM | Cytosol | Nucleus | ||||||
| Expt B |
3 peptides |
12 spectra |
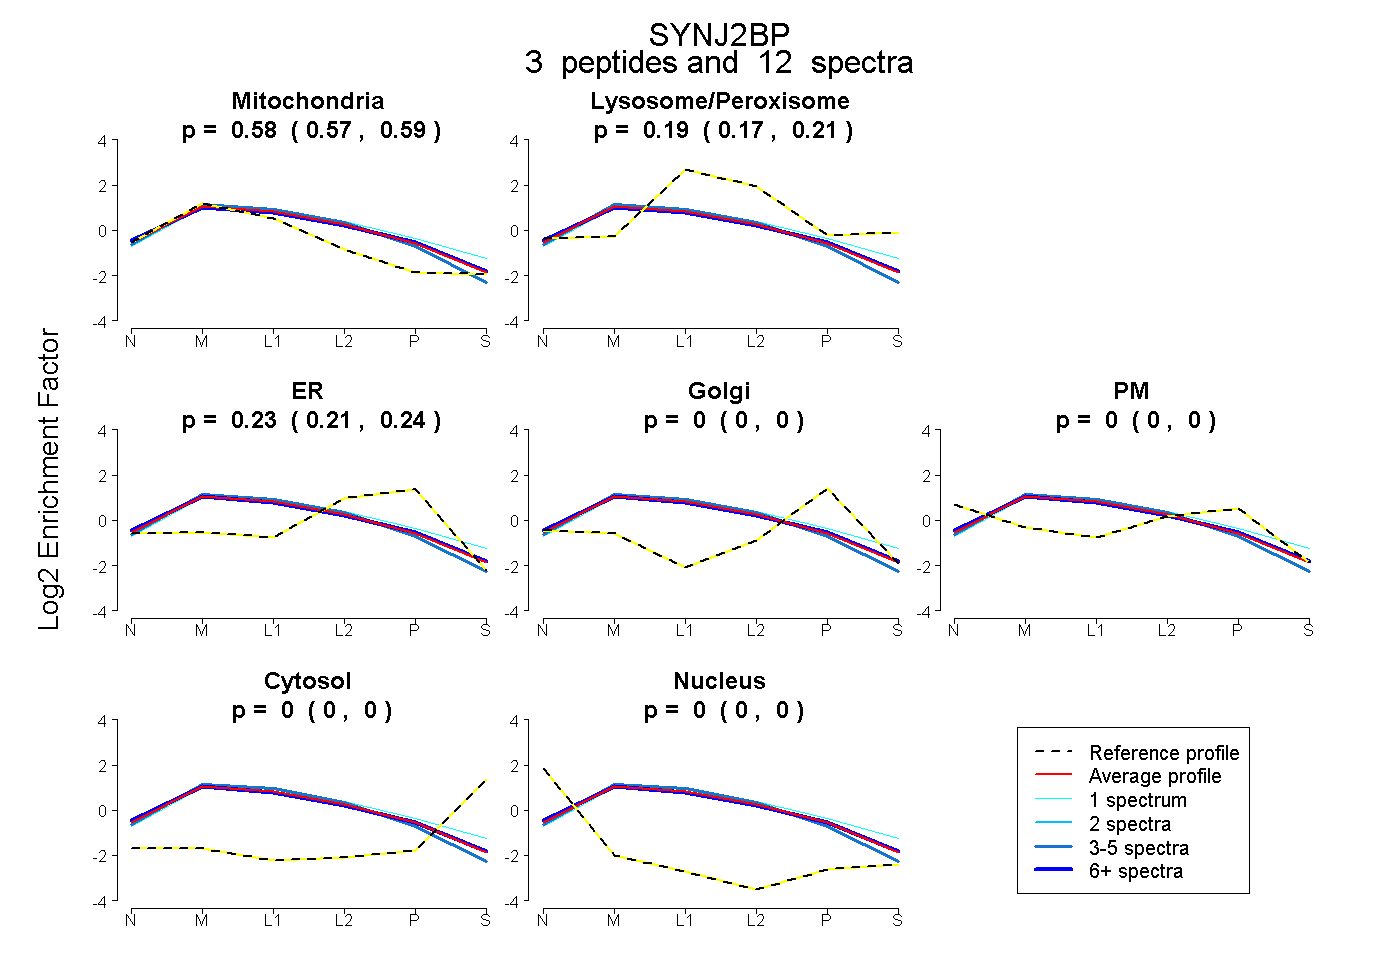 |
0.580 0.566 | 0.591 |
0.194 0.174 | 0.213 |
0.226 0.209 | 0.238 |
0.000 0.000 | 0.000 |
0.000 0.000 | 0.000 |
0.000 0.000 | 0.000 |
0.000 0.000 | 0.000 |
|||
| Plot | Lyso | Other | |||||||||||
| Expt C |
5 peptides |
48 spectra |
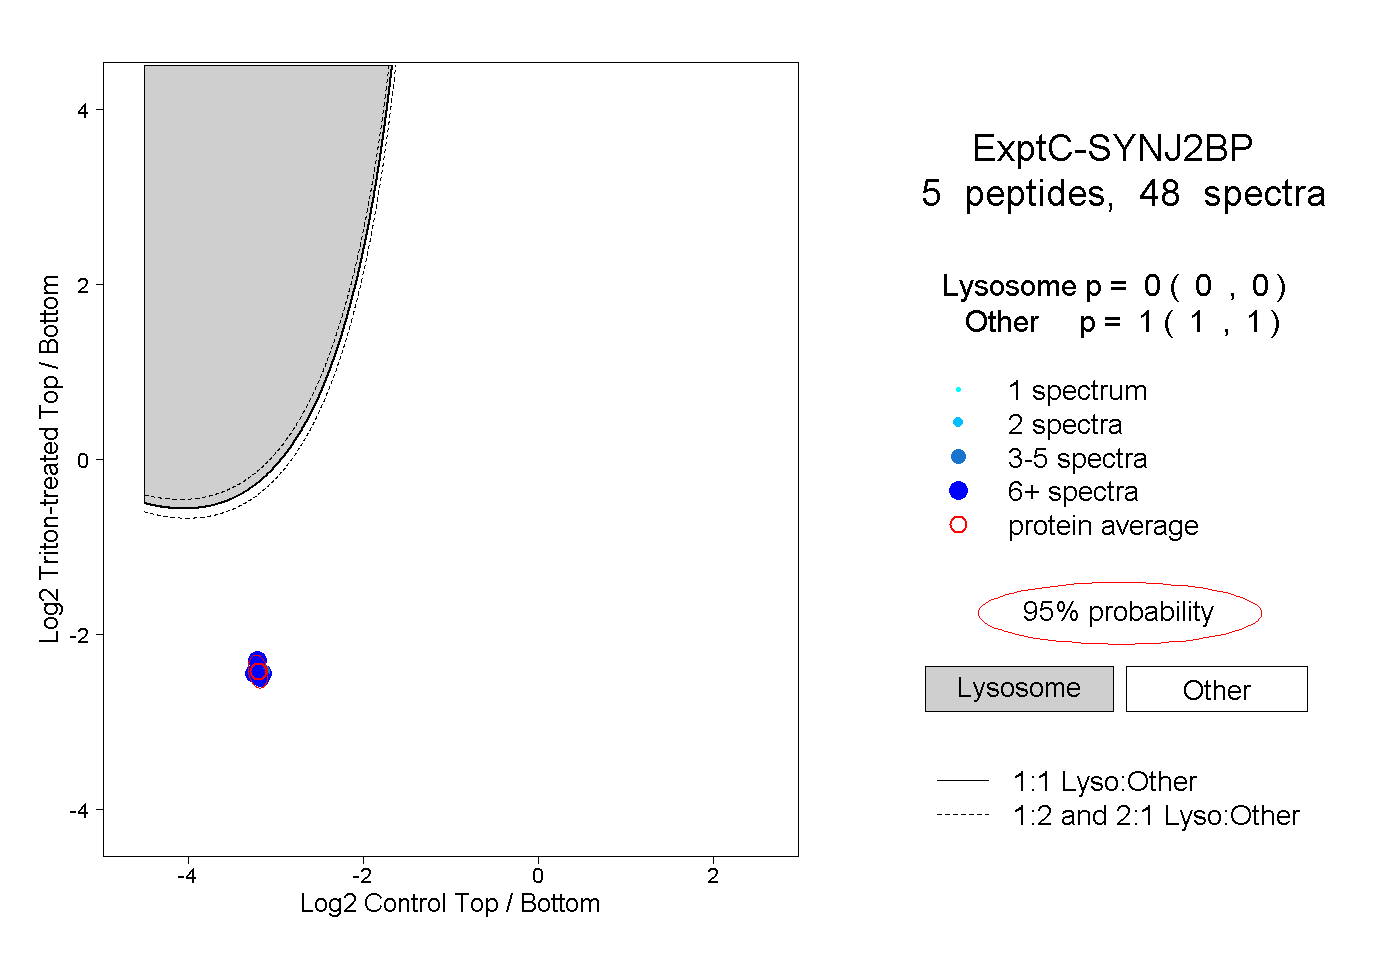 |
0.000 0.000 | 0.000 |
1.000 1.000 | 1.000 |
||||||||
| Plot | Lyso | Other | |||||||||||
| Expt D |
4 peptides |
8 spectra |
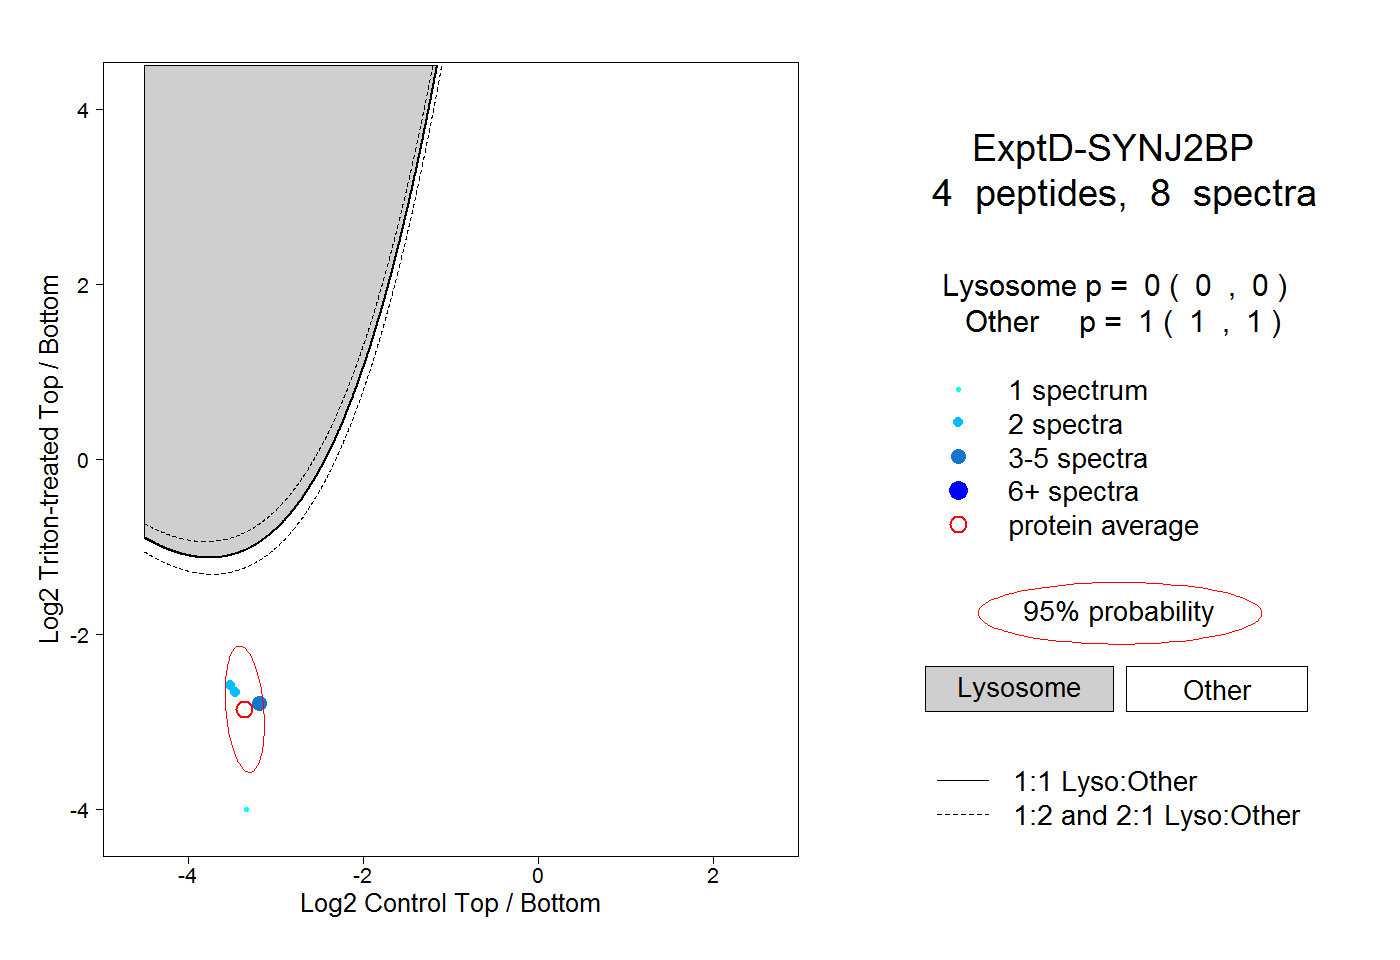 |
0.000 0.000 | 0.000 |
1.000 1.000 | 1.000 |