 9
9peptides
spectra
0.000 | 0.000
0.000 | 0.000
0.000 | 0.000
0.280 | 0.400
0.000 | 0.107
0.000 | 0.000
0.241 | 0.278
0.321 | 0.364
2peptides
spectra
NA | NA
NA | NA
NA | NA
NA | NA
NA | NA
NA | NA
NA | NA
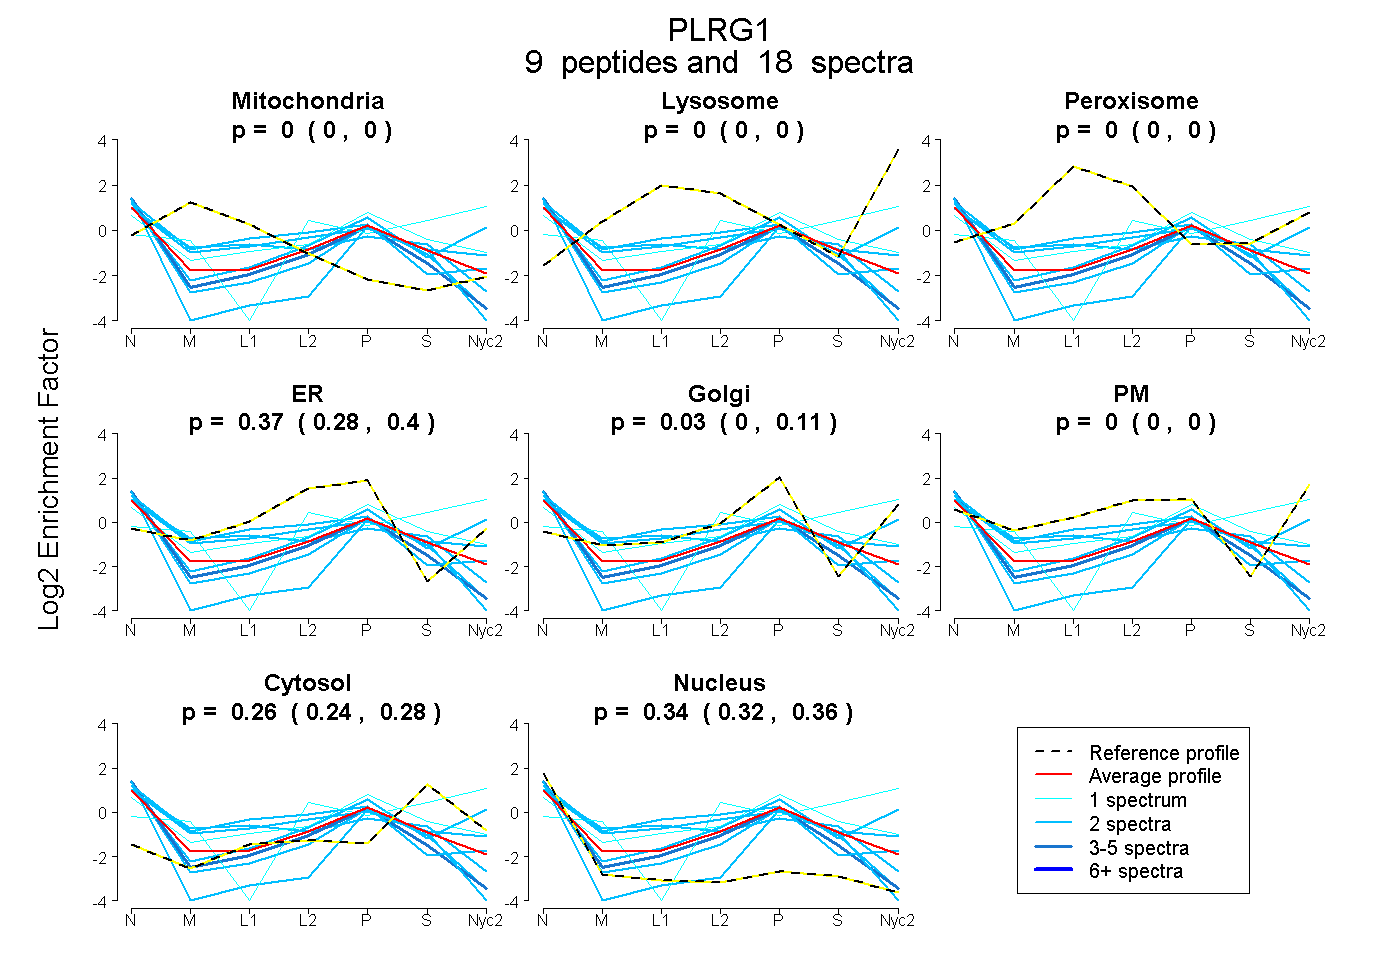
| Plot | Mito | Lyso | Perox | ER | Golgi | PM | Cytosol | Nucleus | |||||
| Expt A |
9 peptides |
18 spectra |
|
0.000 0.000 | 0.000 |
0.000 0.000 | 0.000 |
0.000 0.000 | 0.000 |
0.365 0.280 | 0.400 |
0.028 0.000 | 0.107 |
0.000 0.000 | 0.000 |
0.263 0.241 | 0.278 |
0.344 0.321 | 0.364 |
||
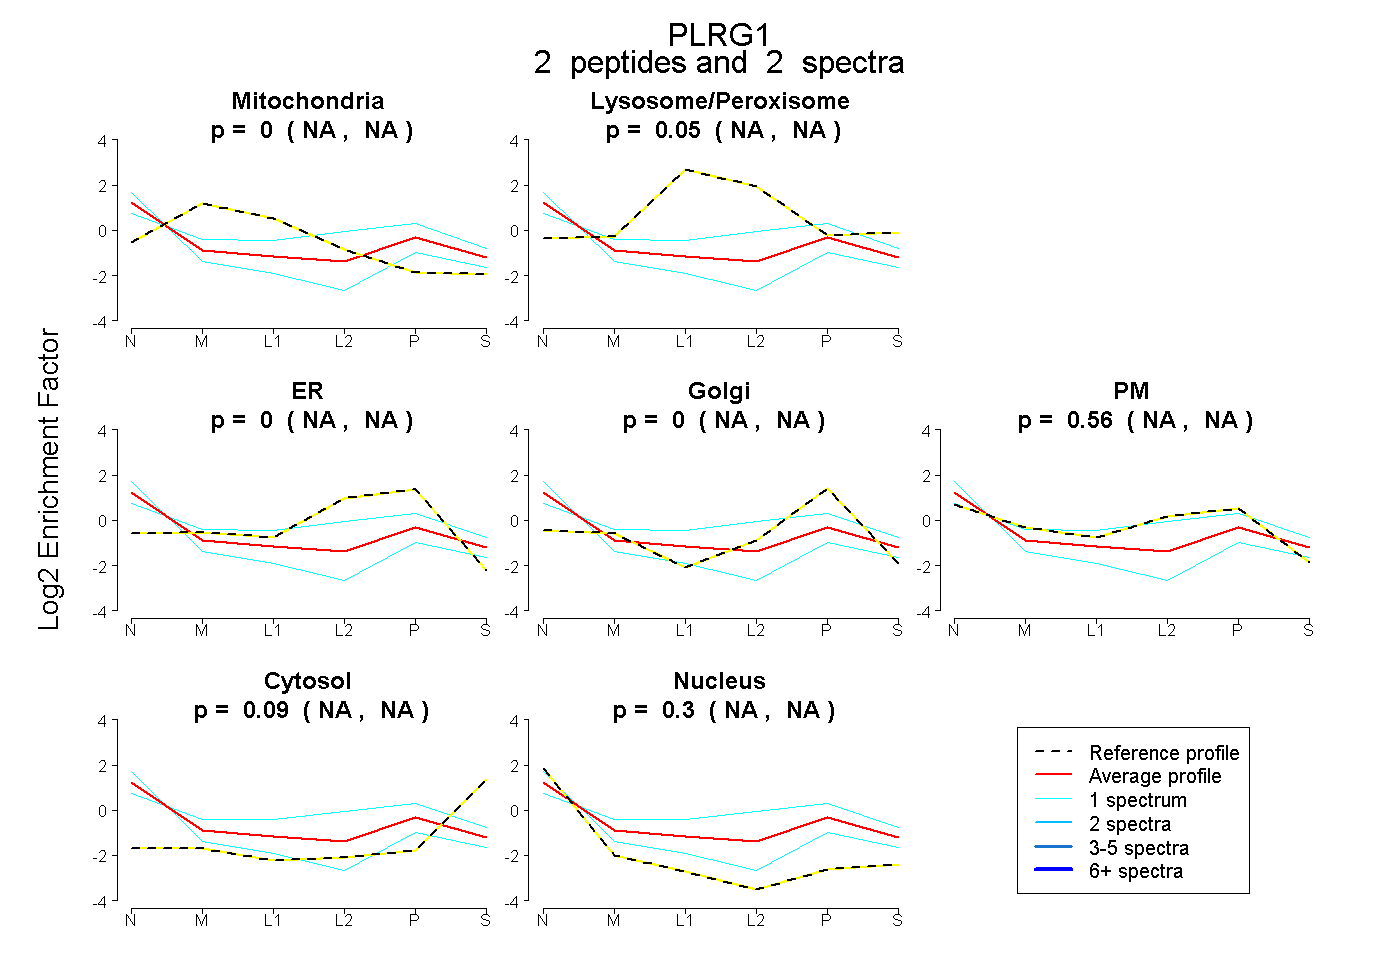
| Plot | Mito | Lyso or Perox | ER | Golgi | PM | Cytosol | Nucleus | ||||||
| Expt B |
2 peptides |
2 spectra |
|
0.000 NA | NA |
0.050 NA | NA |
0.000 NA | NA |
0.000 NA | NA |
0.556 NA | NA |
0.089 NA | NA |
0.304 NA | NA |