 9
9peptides
spectra
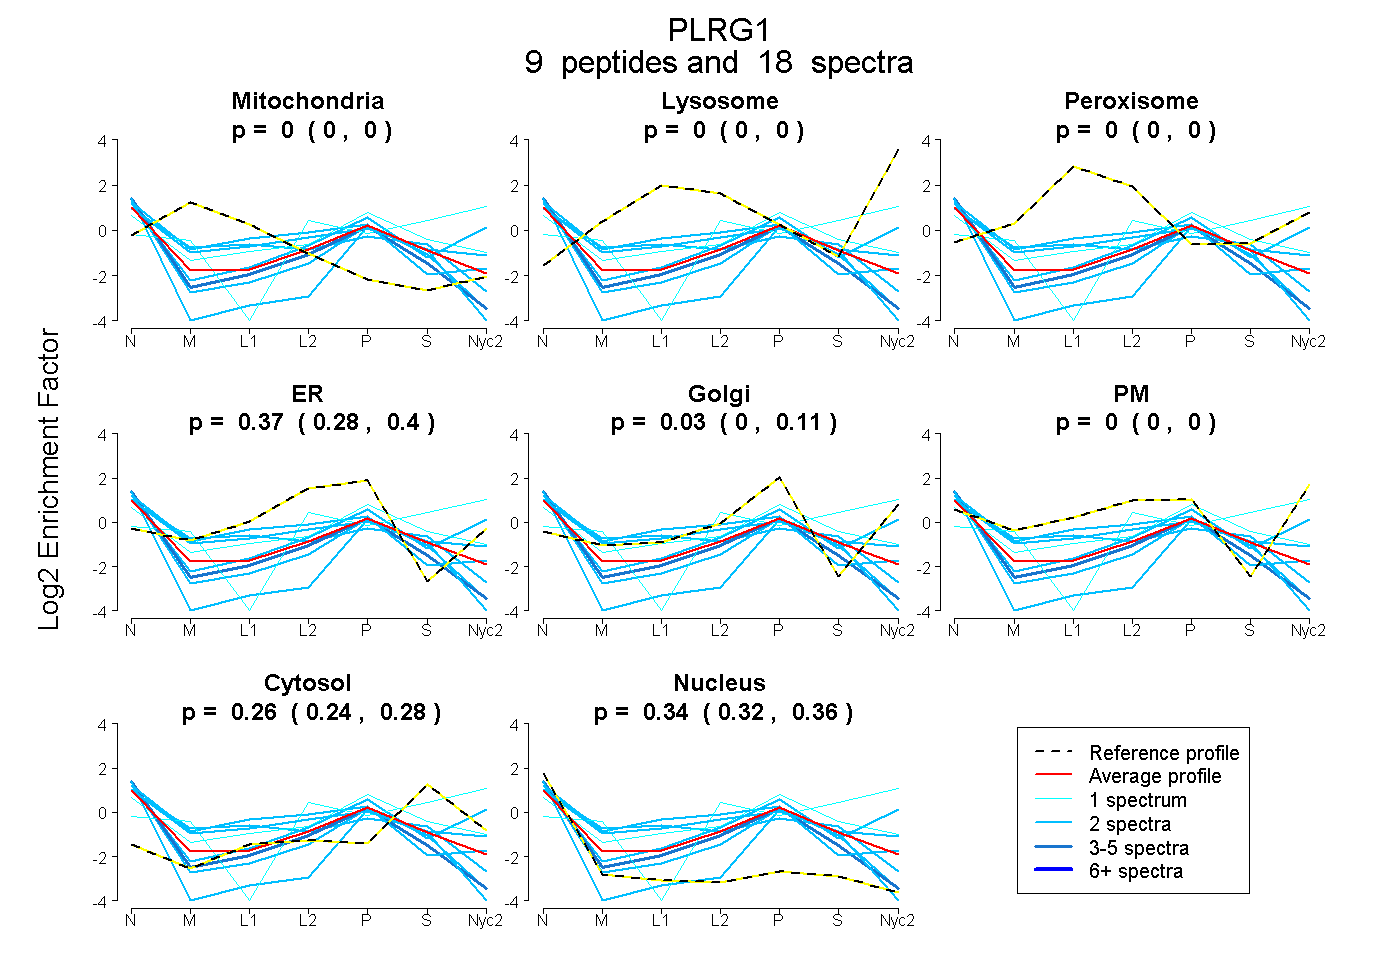
0.000 | 0.000
0.000 | 0.000
0.000 | 0.000
0.280 | 0.400
0.000 | 0.107
0.000 | 0.000
0.241 | 0.278
0.321 | 0.364
| Plot | Mito | Lyso | Perox | ER | Golgi | PM | Cytosol | Nucleus | |||||
| Expt A |
9 peptides |
18 spectra |
|
0.000 0.000 | 0.000 |
0.000 0.000 | 0.000 |
0.000 0.000 | 0.000 |
0.365 0.280 | 0.400 |
0.028 0.000 | 0.107 |
0.000 0.000 | 0.000 |
0.263 0.241 | 0.278 |
0.344 0.321 | 0.364 |
| 2 spectra, IWDLASGK | 0.000 | 0.000 | 0.000 | 0.258 | 0.000 | 0.000 | 0.182 | 0.560 | ||
| 2 spectra, TGYNFQR | 0.020 | 0.000 | 0.180 | 0.459 | 0.000 | 0.000 | 0.000 | 0.341 | ||
| 2 spectra, AVVLHPLHYTFASGSPDNIK | 0.156 | 0.000 | 0.125 | 0.216 | 0.000 | 0.000 | 0.194 | 0.309 | ||
| 2 spectra, VISGHLGWVR | 0.000 | 0.000 | 0.148 | 0.220 | 0.000 | 0.178 | 0.190 | 0.264 | ||
| 2 spectra, TAPAGSEYR | 0.000 | 0.000 | 0.000 | 0.000 | 0.040 | 0.000 | 0.237 | 0.724 | ||
| 4 spectra, LWDLVAGK | 0.000 | 0.000 | 0.000 | 0.348 | 0.000 | 0.000 | 0.094 | 0.558 | ||
| 1 spectrum, SPYLFSCGEDK | 0.000 | 0.000 | 0.000 | 0.272 | 0.149 | 0.088 | 0.349 | 0.141 | ||
| 2 spectra, CWDLEYNK | 0.000 | 0.000 | 0.000 | 0.000 | 0.322 | 0.258 | 0.201 | 0.219 | ||
| 1 spectrum, VHAAVQPGSLDSESGIFACAFDR | 0.000 | 0.000 | 0.000 | 0.000 | 0.250 | 0.208 | 0.542 | 0.000 |
| Plot | Mito | Lyso or Perox | ER | Golgi | PM | Cytosol | Nucleus | ||||||
| Expt B |
2 peptides |
2 spectra |
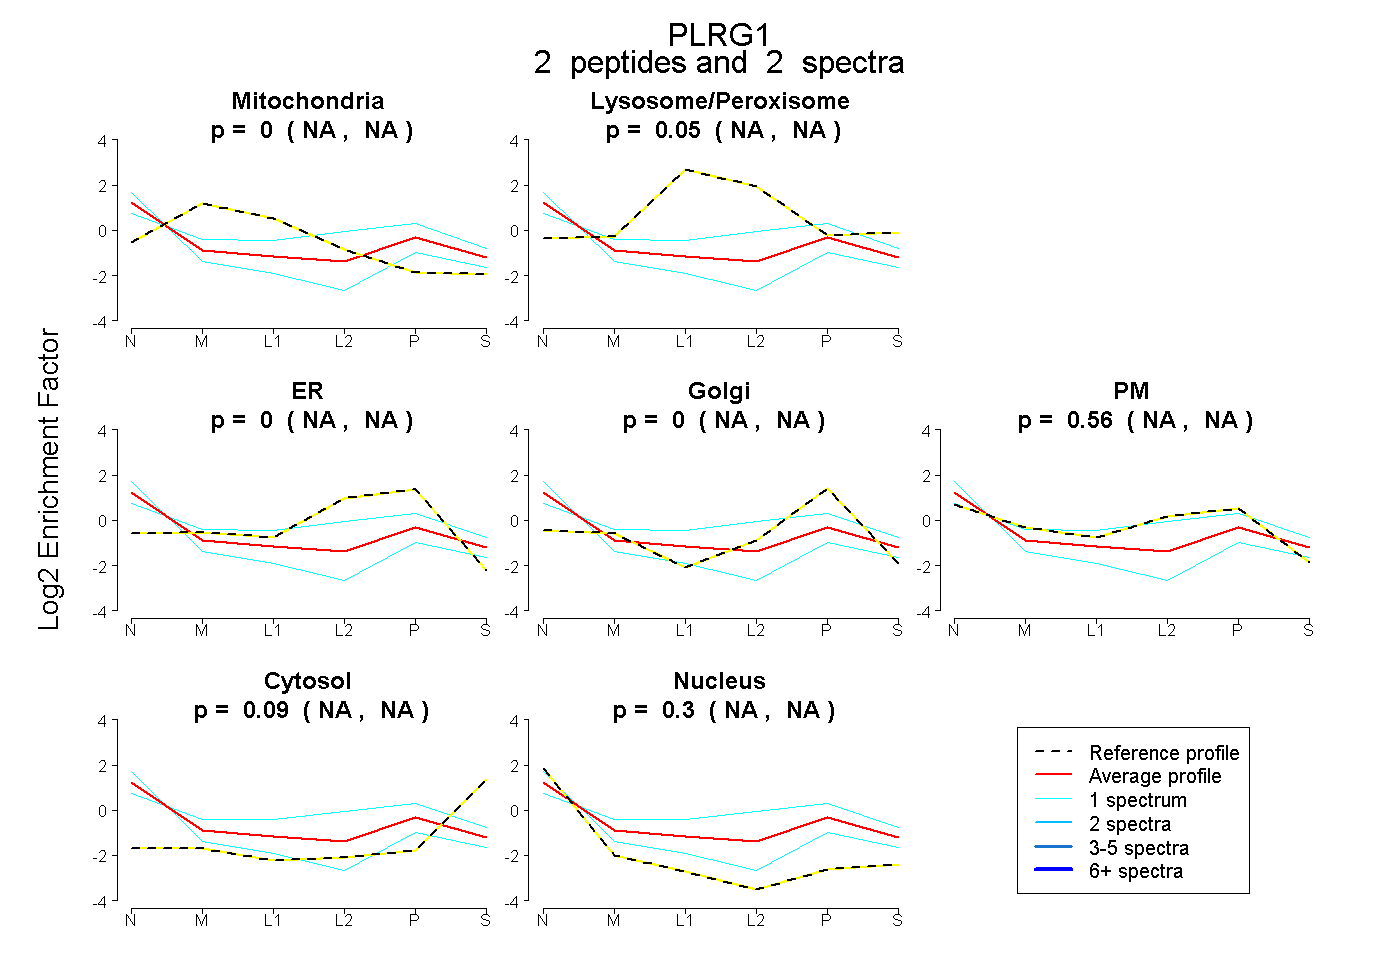 |
0.000 NA | NA |
0.050 NA | NA |
0.000 NA | NA |
0.000 NA | NA |
0.556 NA | NA |
0.089 NA | NA |
0.304 NA | NA |