 8
8peptides
spectra
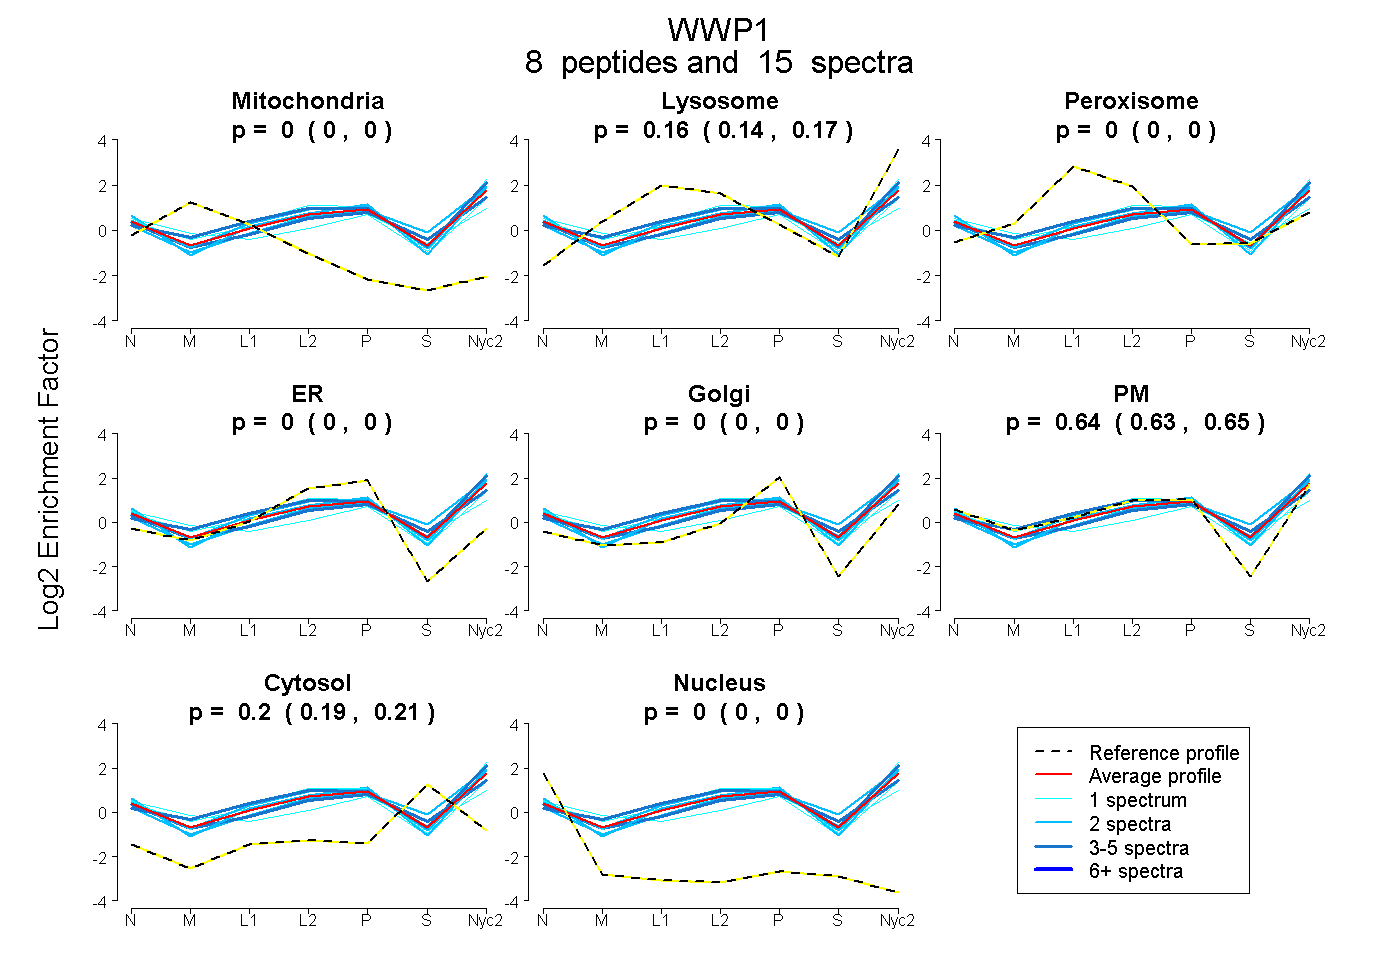
0.000 | 0.000
0.144 | 0.167
0.000 | 0.000
0.000 | 0.000
0.000 | 0.000
0.629 | 0.654
0.192 | 0.208
0.000 | 0.000
1peptide
spectrum
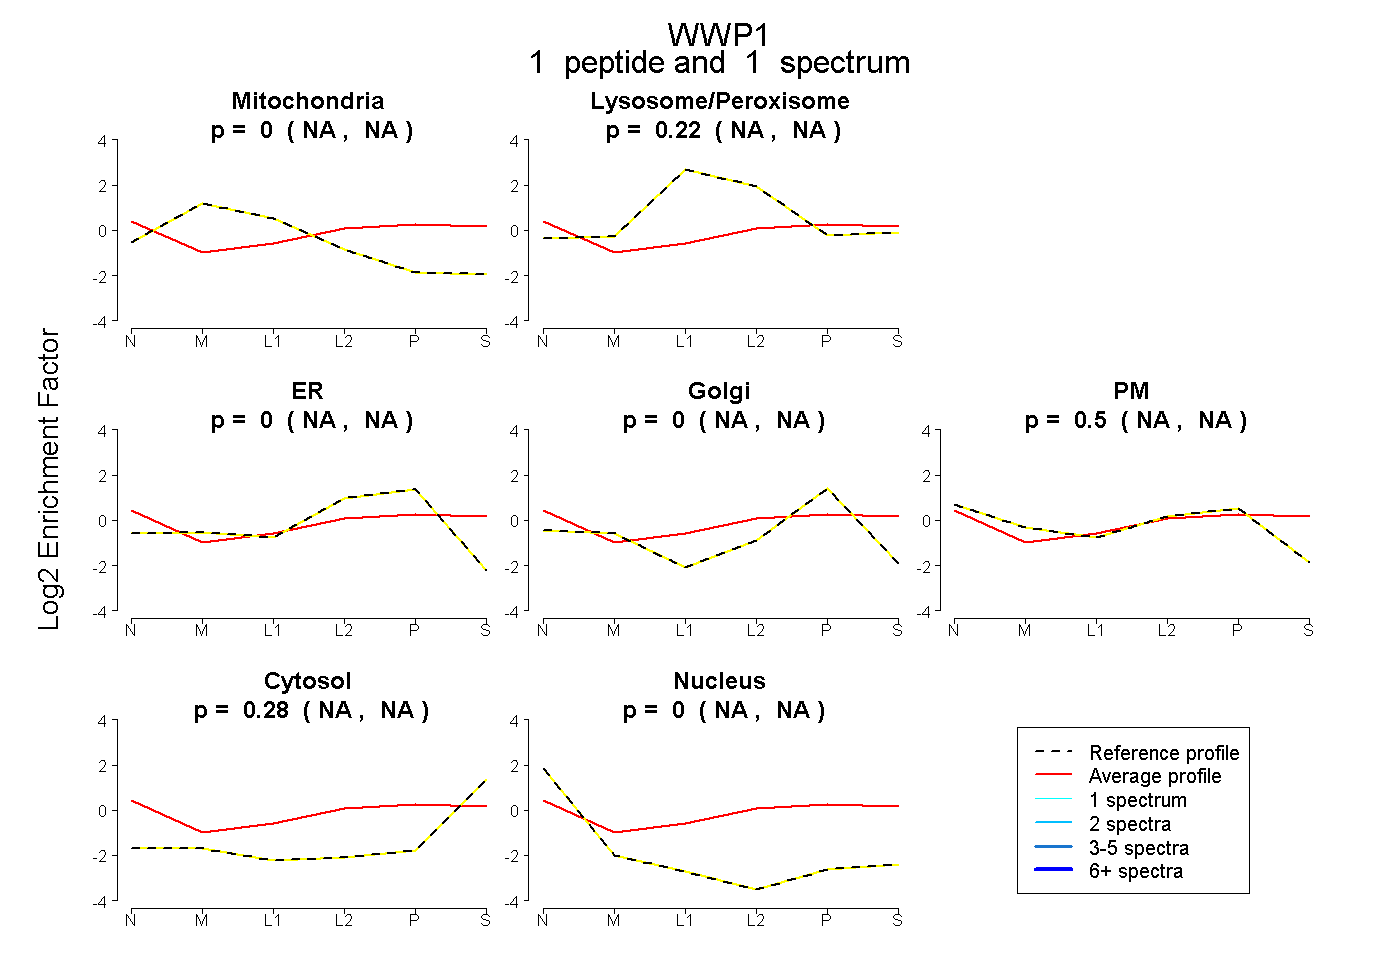
NA | NA
NA | NA
NA | NA
NA | NA
NA | NA
NA | NA
NA | NA
21peptides
spectra
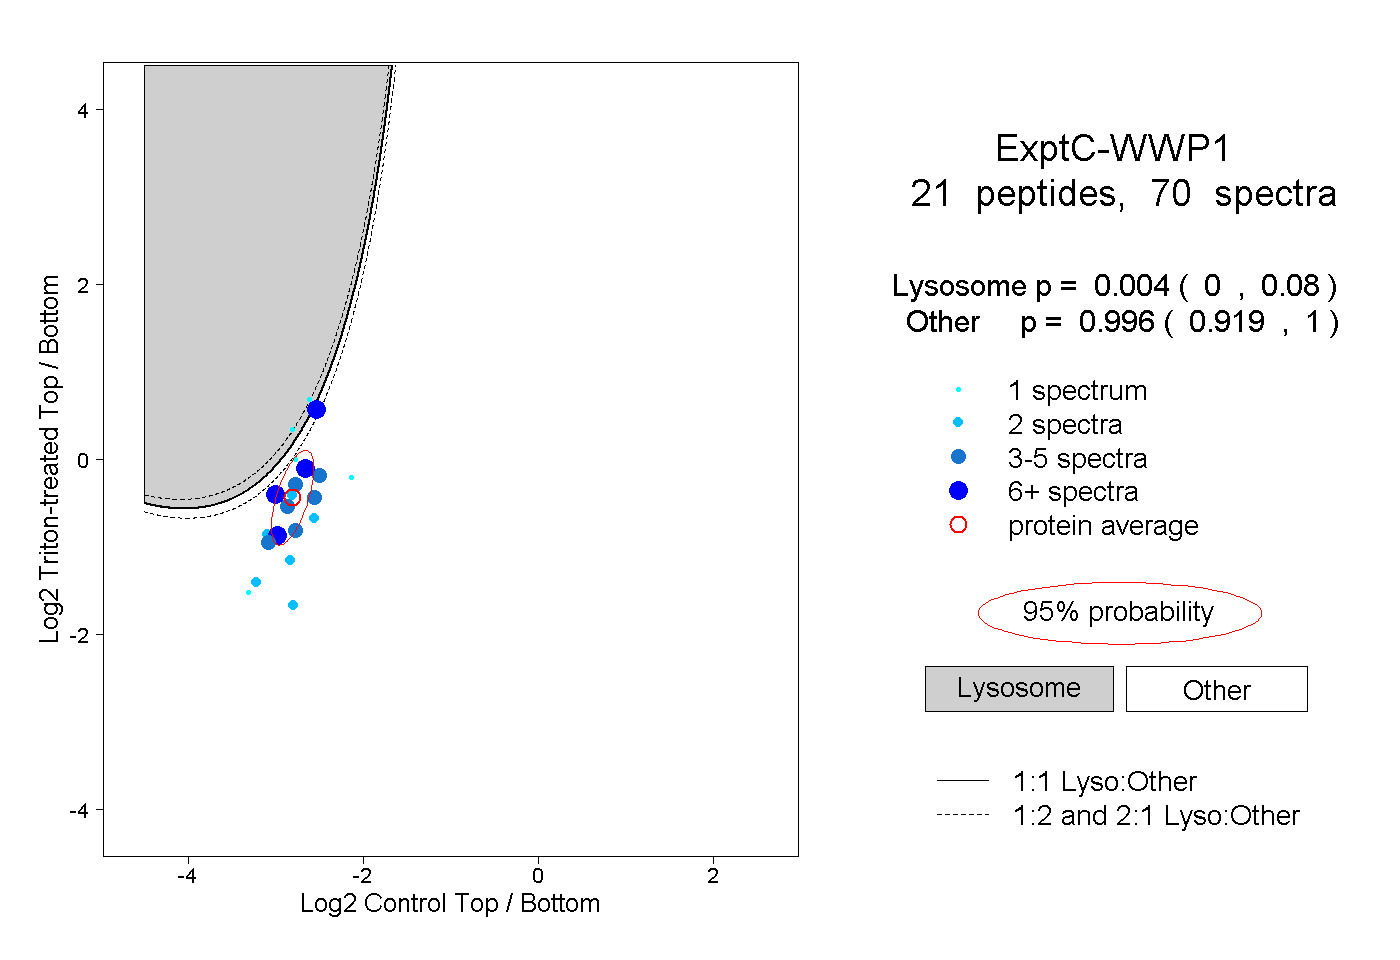
0.000 | 0.080
0.919 | 1.000
2peptides
spectra
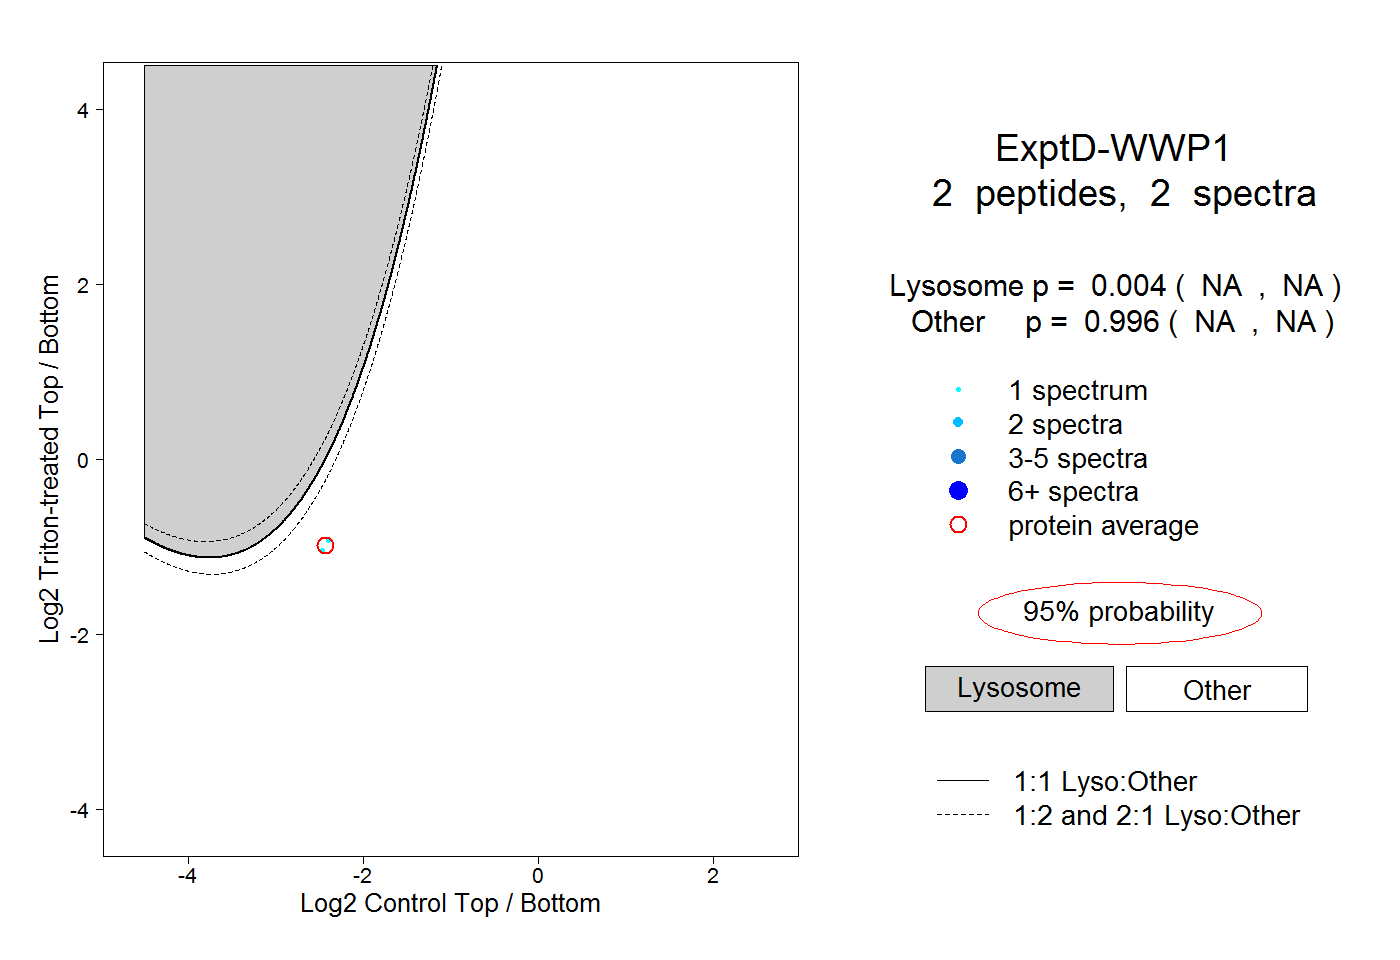
NA | NA
NA | NA