WWP1
[ENSRNOP00000009047]
Main page
| | | Plot |
Mito |
Lyso |
|
Perox |
ER |
Golgi |
PM |
Cytosol |
Nucleus |
|
| Expt A |
 8
8
peptides |
15
spectra |
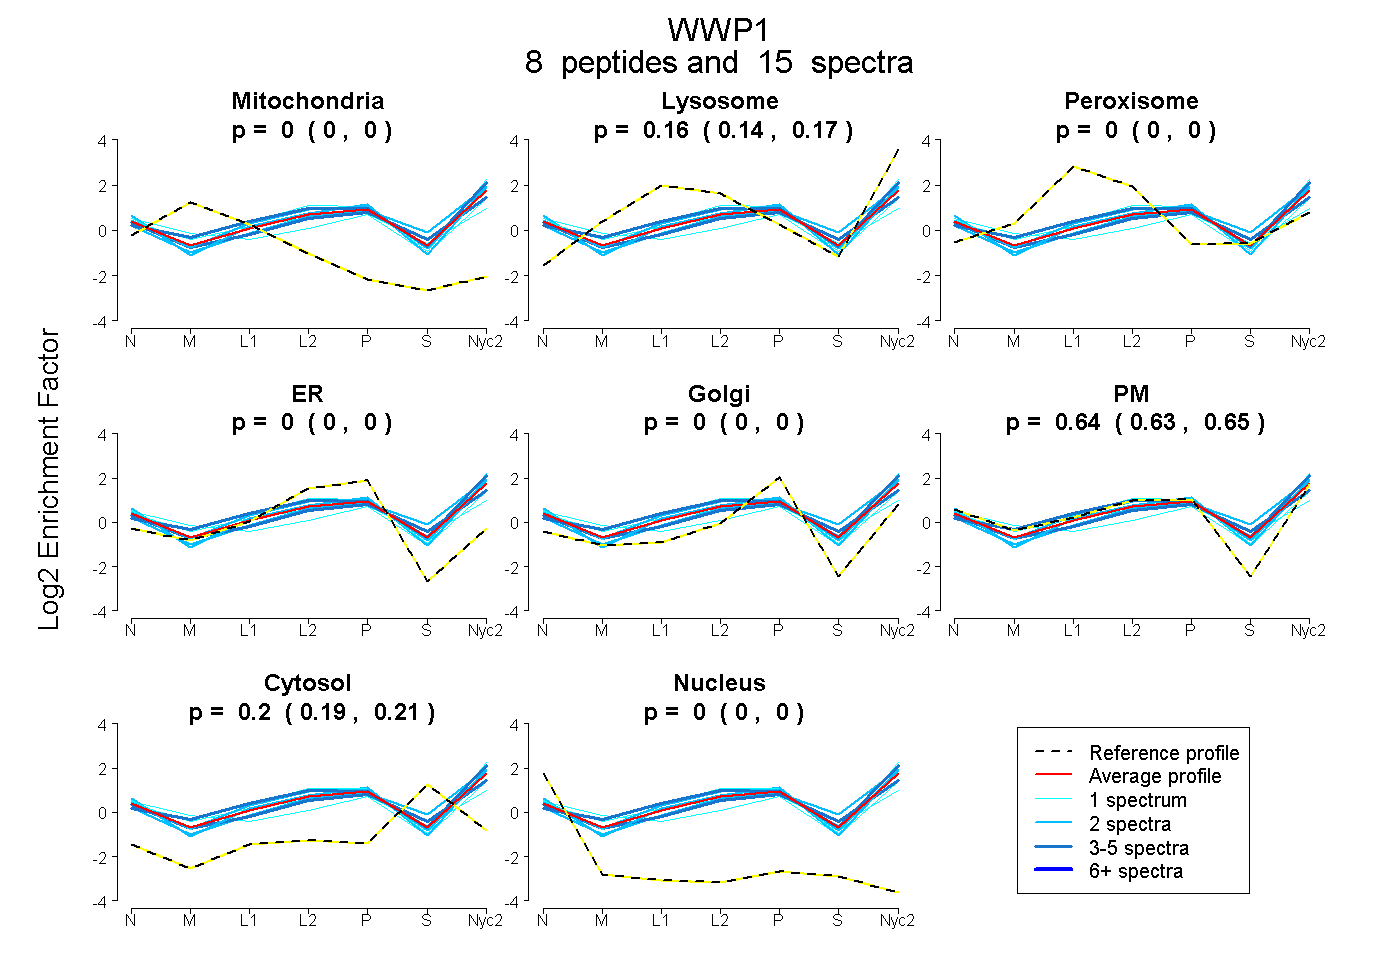 |
0.000
0.000 | 0.000 |
0.156
0.144 | 0.167 |
|
0.000
0.000 | 0.000 |
0.000
0.000 | 0.000 |
0.000
0.000 | 0.000 |
0.643
0.629 | 0.654 |
0.201
0.192 | 0.208 |
0.000
0.000 | 0.000 |
|
| | | Plot |
Mito |
|
Lyso or Perox |
|
ER |
Golgi |
PM |
Cytosol |
Nucleus |
|
| Expt B |
1
peptide |
1
spectrum |
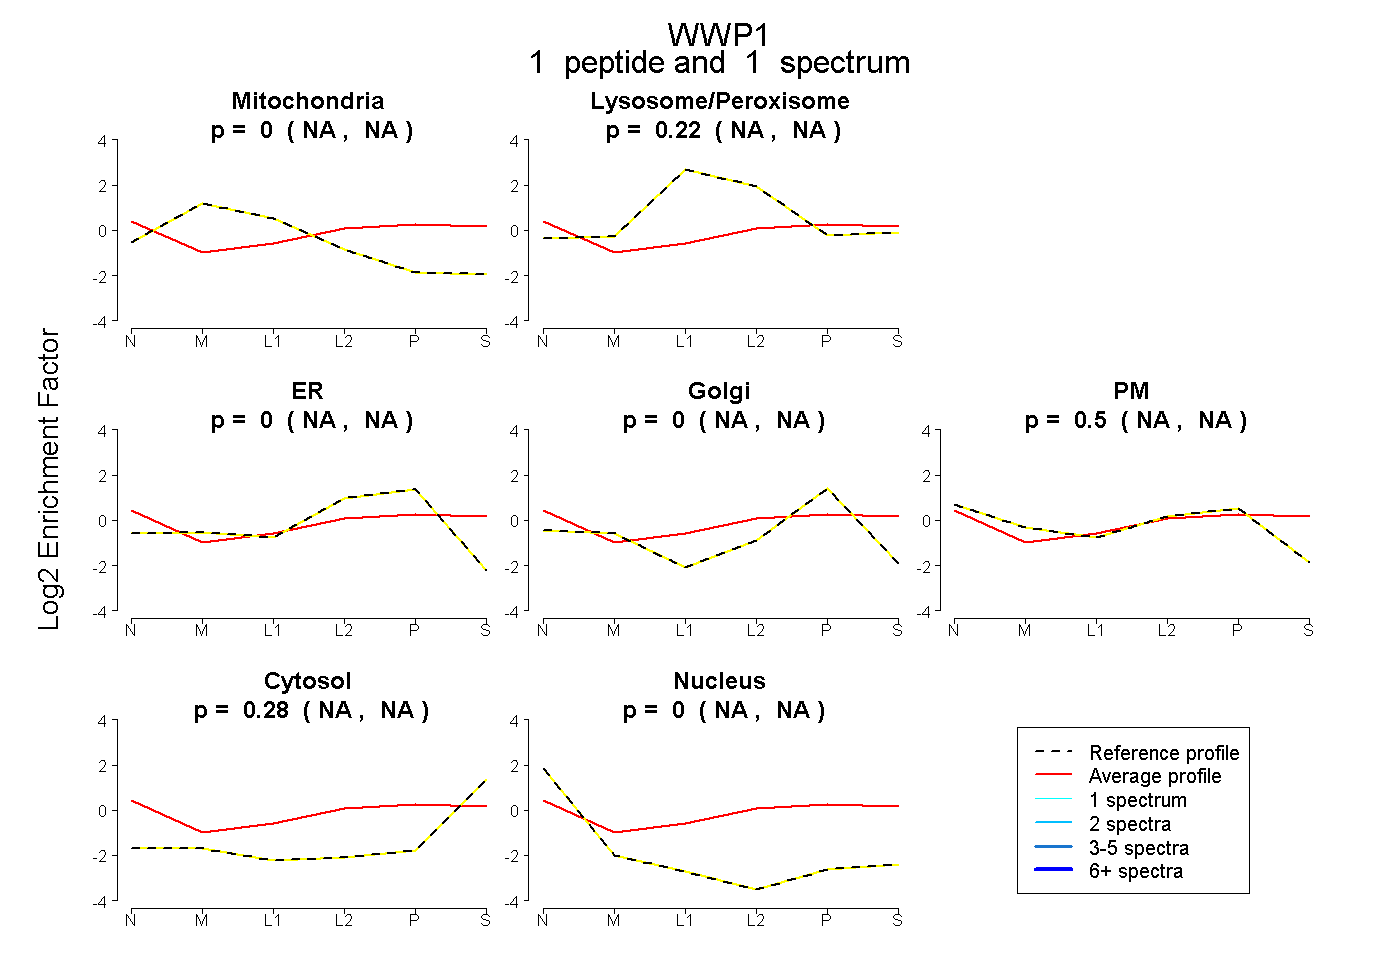 |
0.000
NA | NA |
|
0.221
NA | NA |
|
0.000
NA | NA |
0.000
NA | NA |
0.501
NA | NA |
0.278
NA | NA |
0.000
NA | NA |
|
| | | Plot |
|
Lyso |
|
|
|
|
|
|
|
Other |
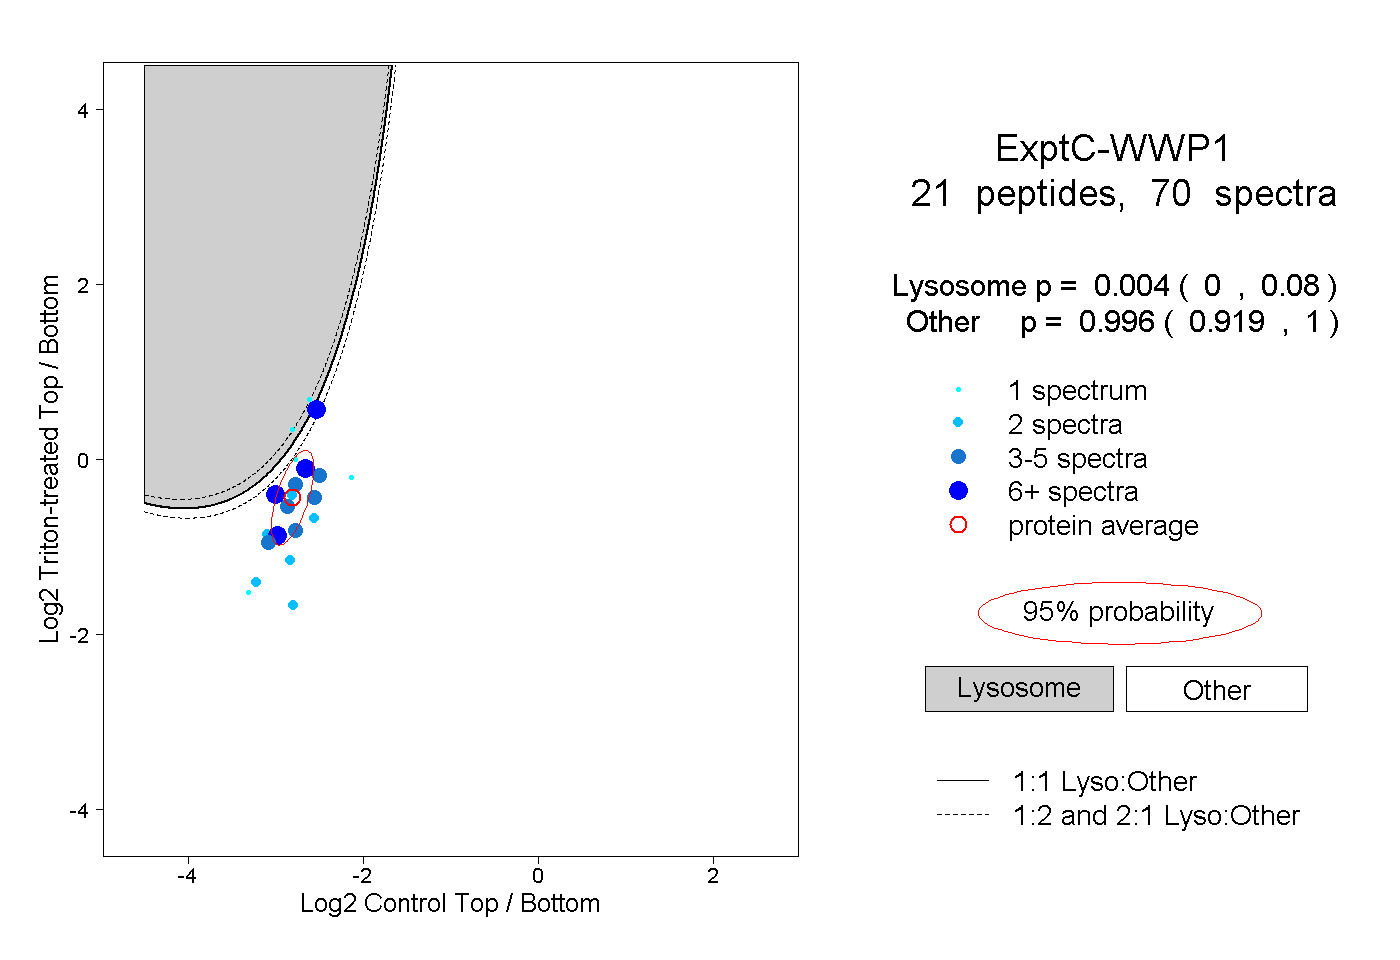
| Expt C |
21
peptides |
70
spectra |
 |
|
0.004
0.000 | 0.080 |
|
|
|
|
|
|
|
0.996
0.919 | 1.000 |
| 4 spectra, YLCQSNALPSHVK |
|
0.000 |
|
|
|
|
|
|
|
1.000 |
| 3 spectra, VTSHDLK |
|
0.003 |
|
|
|
|
|
|
|
0.997 |
| 12 spectra, GGPQIAYER |
|
0.042 |
|
|
|
|
|
|
|
0.958 |
| 2 spectra, SSSSSNPK |
|
0.006 |
|
|
|
|
|
|
|
0.994 |
| 1 spectrum, SLIDPDSDSR |
|
0.000 |
|
|
|
|
|
|
|
1.000 |
| 1 spectrum, NFEQWQSQR |
|
0.816 |
|
|
|
|
|
|
|
0.184 |
| 1 spectrum, GVEEQTK |
|
0.000 |
|
|
|
|
|
|
|
1.000 |
| 8 spectra, GVQEQTK |
|
0.361 |
|
|
|
|
|
|
|
0.639 |
| 2 spectra, LLQFVTGTCR |
|
0.000 |
|
|
|
|
|
|
|
1.000 |
| 1 spectrum, FIDTGFSLPFYK |
|
0.829 |
|
|
|
|
|
|
|
0.171 |
| 2 spectra, QVLLTHNR |
|
0.000 |
|
|
|
|
|
|
|
1.000 |
| 4 spectra, GEEGLDYGGIAR |
|
0.001 |
|
|
|
|
|
|
|
0.999 |
| 6 spectra, VTVSSAK |
|
0.000 |
|
|
|
|
|
|
|
1.000 |
| 2 spectra, TTTWQRPTMESVR |
|
0.000 |
|
|
|
|
|
|
|
1.000 |
| 2 spectra, DTWLPR |
|
0.001 |
|
|
|
|
|
|
|
0.999 |
| 4 spectra, NNSGFDK |
|
0.000 |
|
|
|
|
|
|
|
1.000 |
| 6 spectra, SYEQLK |
|
0.014 |
|
|
|
|
|
|
|
0.986 |
| 3 spectra, LDLPPYK |
|
0.011 |
|
|
|
|
|
|
|
0.989 |
| 3 spectra, SHTCFNR |
|
0.000 |
|
|
|
|
|
|
|
1.000 |
| 2 spectra, VYFVNHNTK |
|
0.000 |
|
|
|
|
|
|
|
1.000 |
| 1 spectrum, LYVIFR |
|
0.121 |
|
|
|
|
|
|
|
0.879 |
| | | Plot |
|
Lyso |
|
|
|
|
|
|
|
Other |
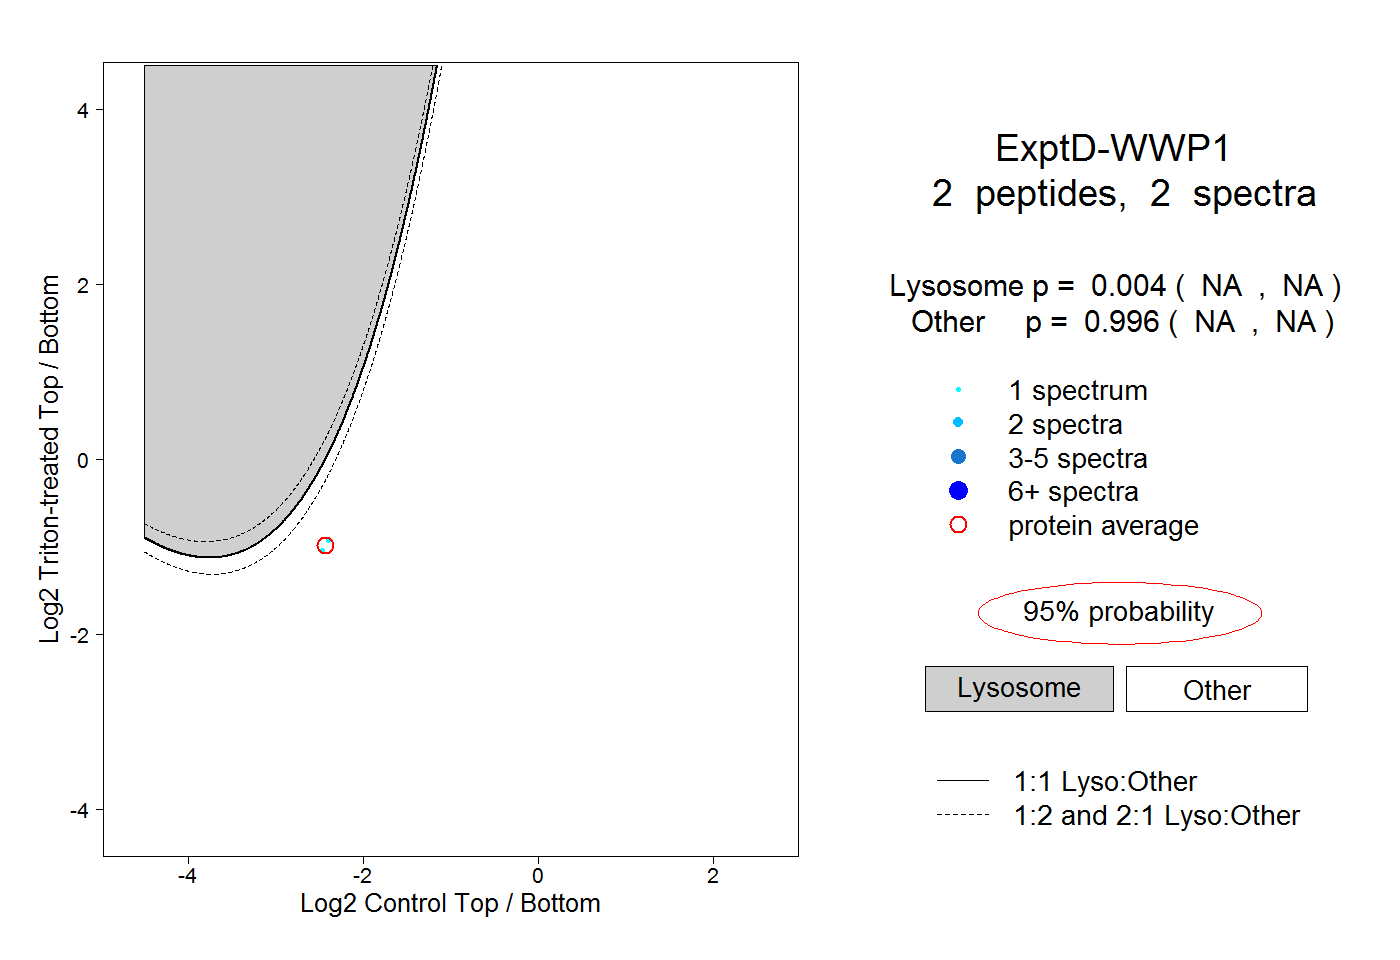
| Expt D |
2
peptides |
2
spectra |
 |
|
0.004
NA | NA |
|
|
|
|
|
|
|
0.996
NA | NA |