 4
4peptides
spectra
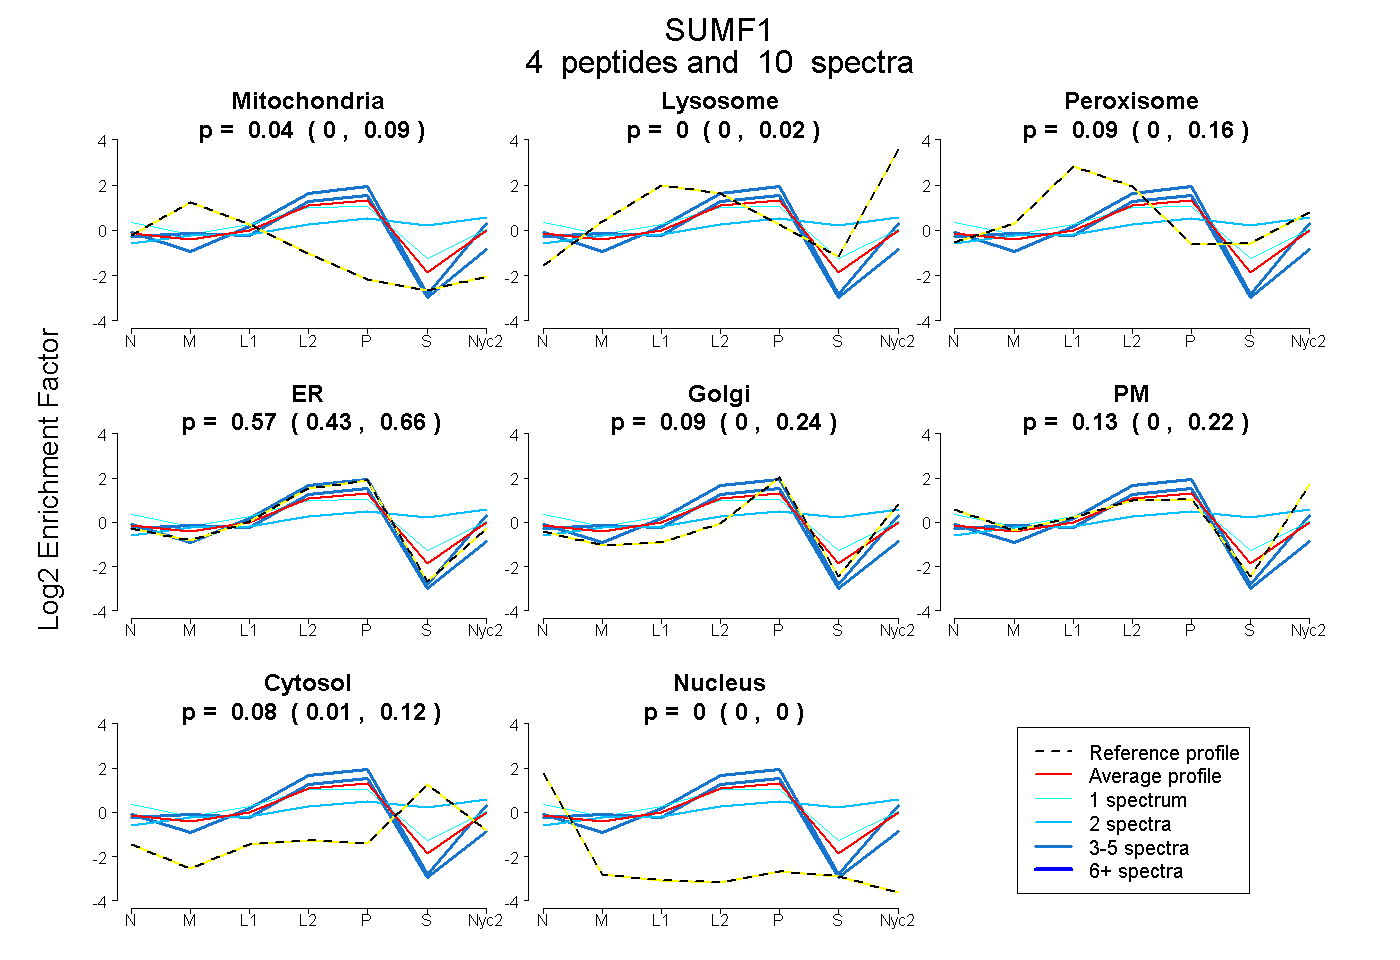
0.000 | 0.093
0.000 | 0.018
0.002 | 0.155
0.431 | 0.662
0.000 | 0.239
0.000 | 0.219
0.007 | 0.125
0.000 | 0.000
4peptides
spectra
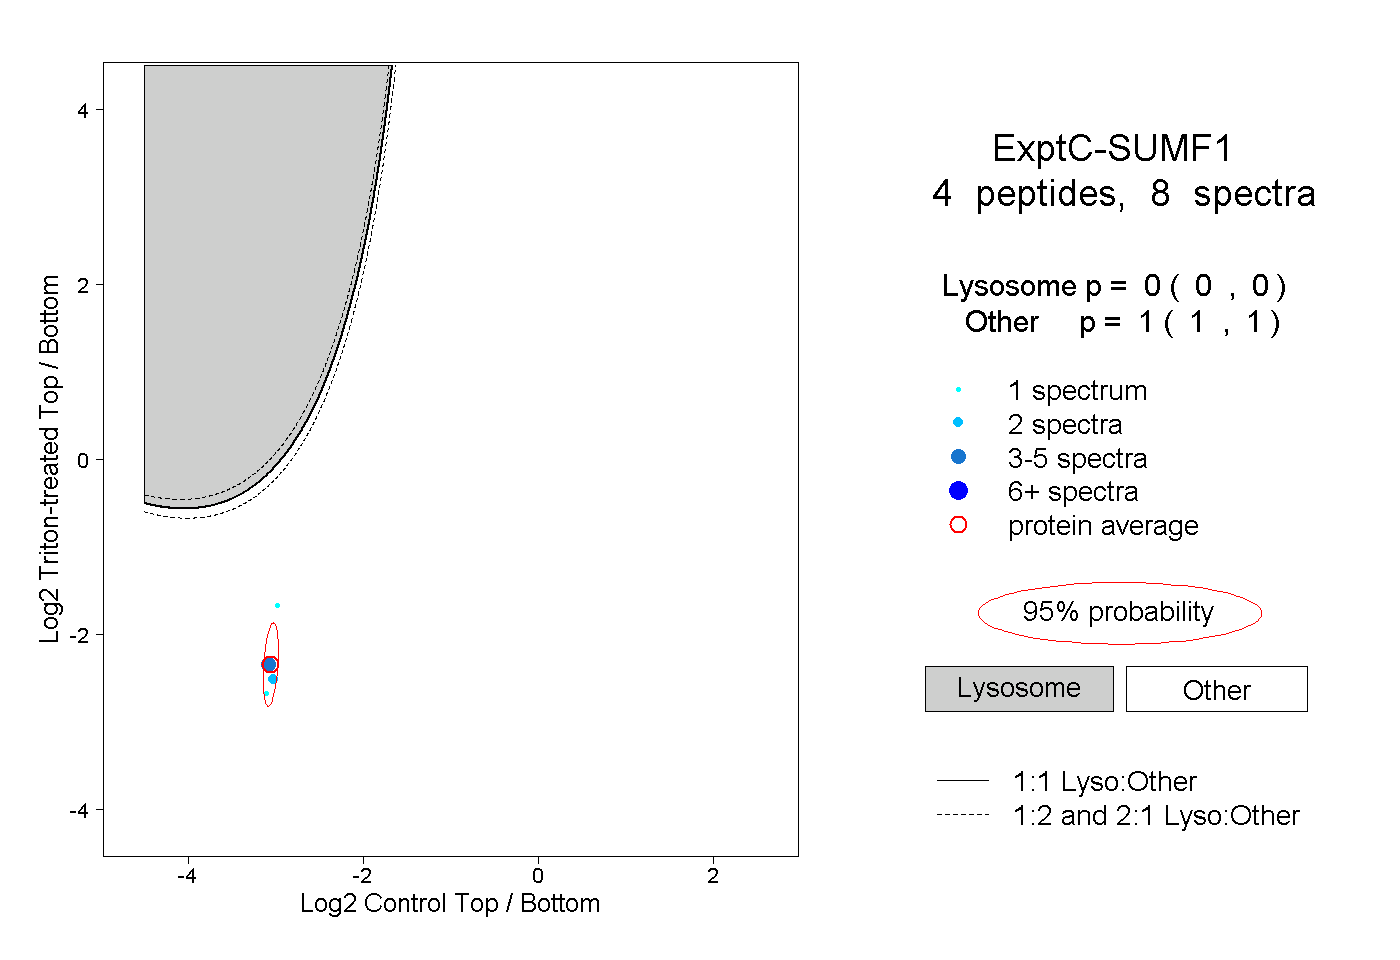
0.000 | 0.000
1.000 | 1.000
1peptide
spectra
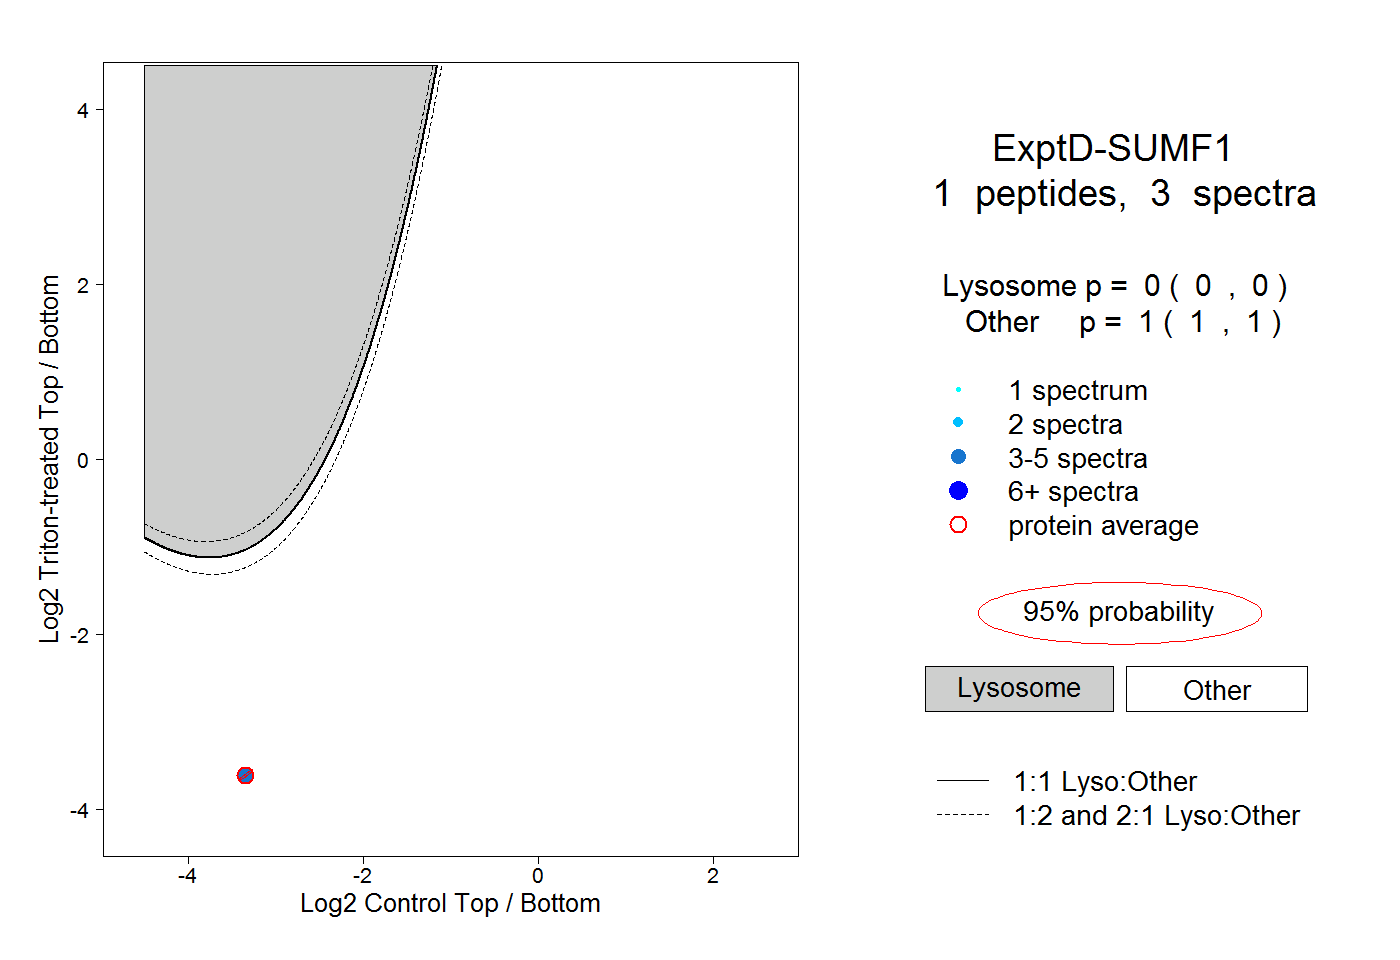
0.000 | 0.000
1.000 | 1.000