 4
4peptides
spectra
0.000 | 0.093
0.000 | 0.018
0.002 | 0.155
0.431 | 0.662
0.000 | 0.239
0.000 | 0.219
0.007 | 0.125
0.000 | 0.000
| Plot | Mito | Lyso | Perox | ER | Golgi | PM | Cytosol | Nucleus | |||||
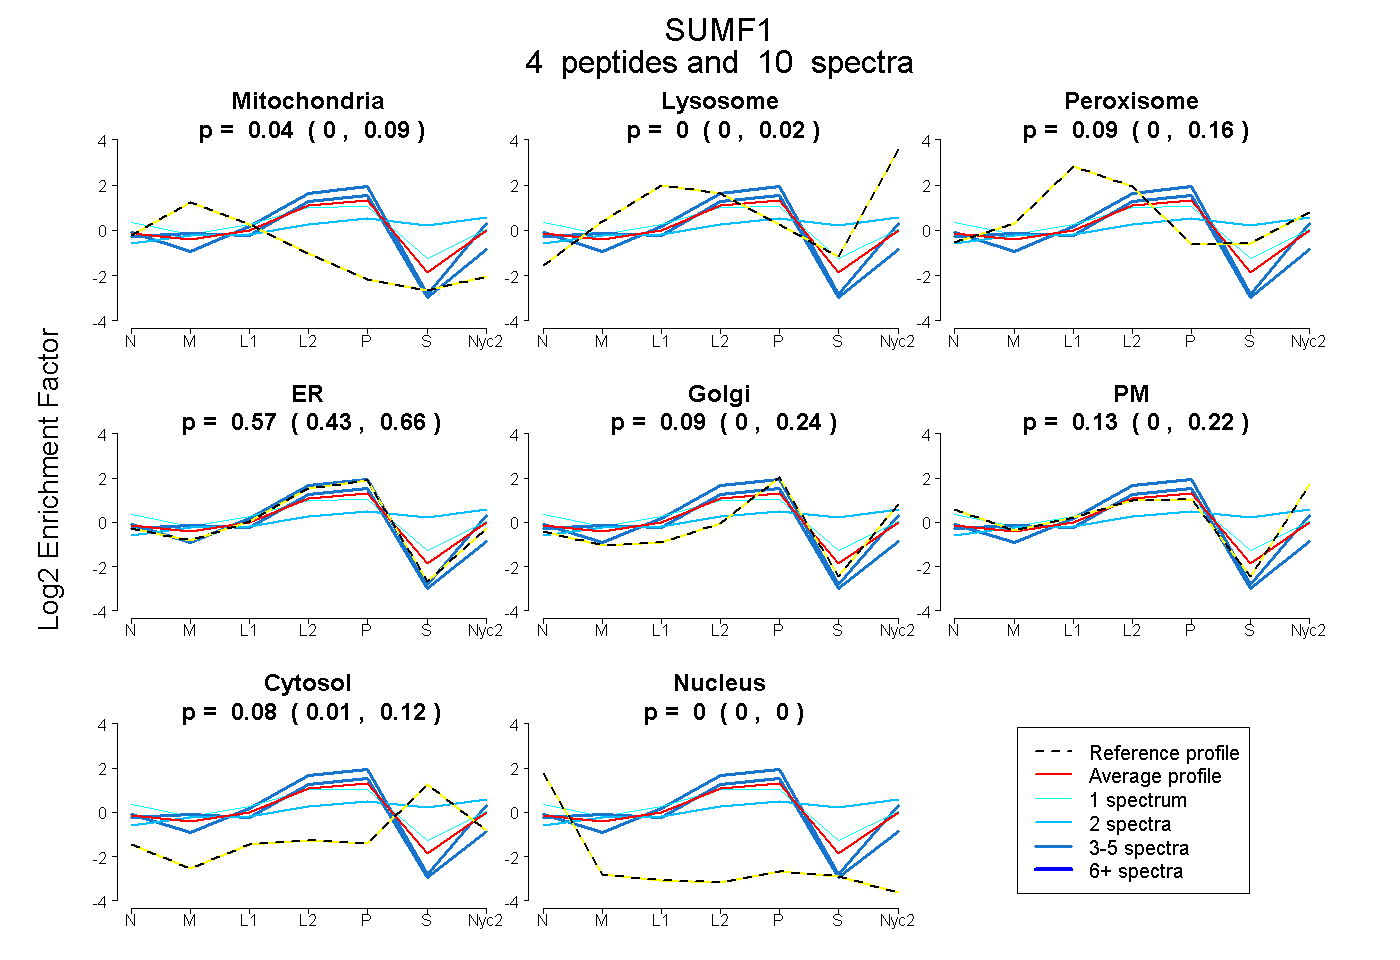
| Expt A |
4 peptides |
10 spectra |
|
0.041 0.000 | 0.093 |
0.000 0.000 | 0.018 |
0.090 0.002 | 0.155 |
0.573 0.431 | 0.662 |
0.089 0.000 | 0.239 |
0.131 0.000 | 0.219 |
0.076 0.007 | 0.125 |
0.000 0.000 | 0.000 |
| 2 spectra, LPTEAEWEYSCR | 0.000 | 0.116 | 0.248 | 0.000 | 0.305 | 0.000 | 0.331 | 0.000 | ||
| 1 spectrum, HPEGPDSTILHR | 0.042 | 0.000 | 0.164 | 0.407 | 0.000 | 0.271 | 0.116 | 0.000 | ||
| 3 spectra, LFPWGNK | 0.151 | 0.000 | 0.000 | 0.849 | 0.000 | 0.000 | 0.000 | 0.000 | ||
| 4 spectra, EANAQGLTSGPR | 0.000 | 0.000 | 0.000 | 0.808 | 0.000 | 0.192 | 0.000 | 0.000 |
| Plot | Lyso | Other | |||||||||||
| Expt C |
4 peptides |
8 spectra |
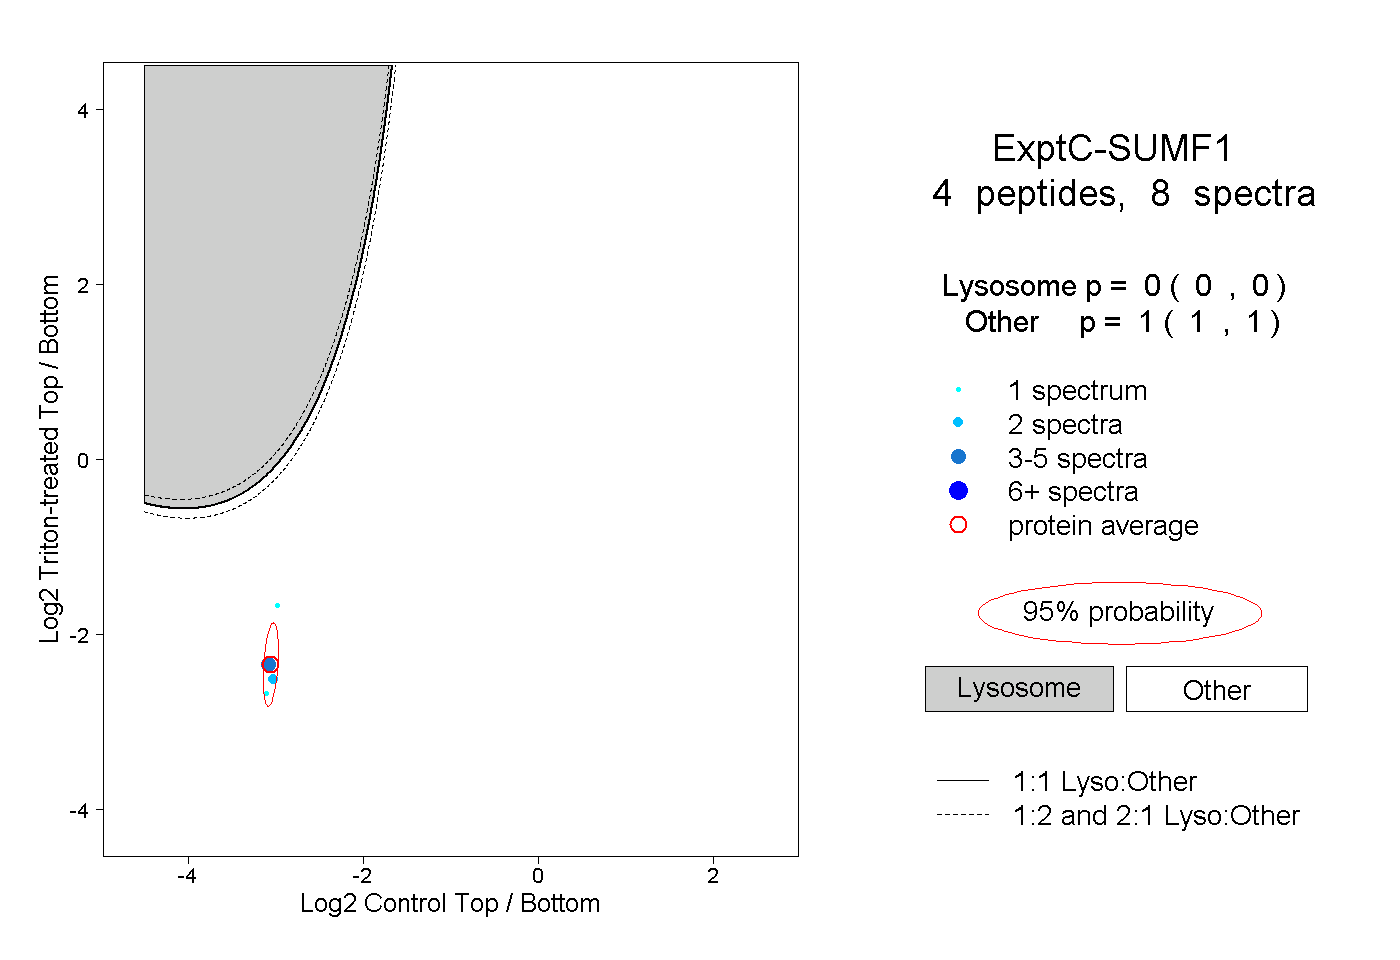 |
0.000 0.000 | 0.000 |
1.000 1.000 | 1.000 |
||||||||
| Plot | Lyso | Other | |||||||||||
| Expt D |
1 peptide |
3 spectra |
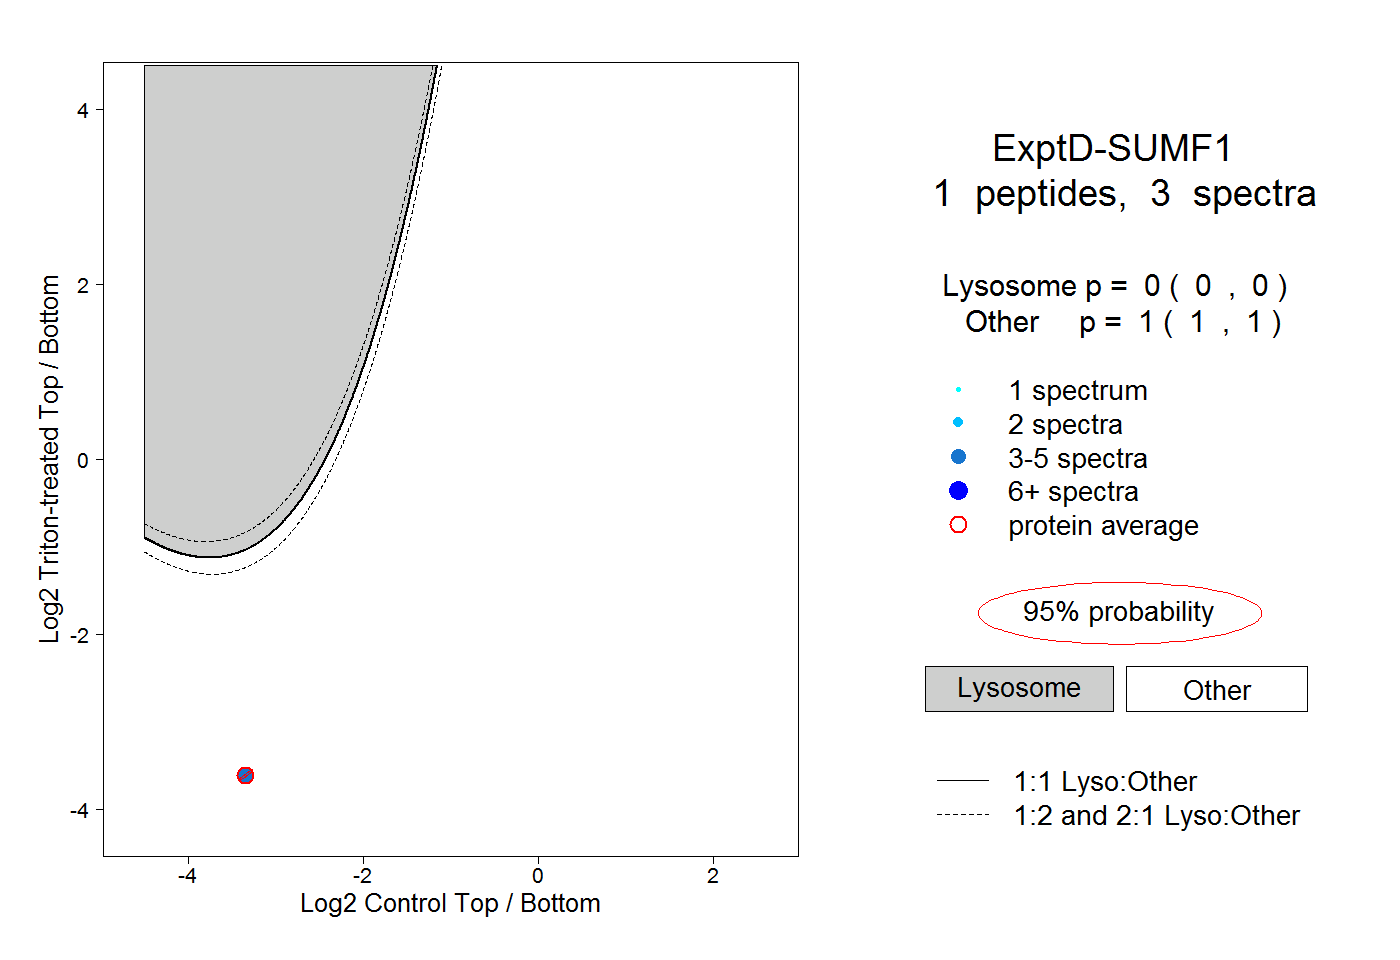 |
0.000 0.000 | 0.000 |
1.000 1.000 | 1.000 |