 11
11peptides
spectra
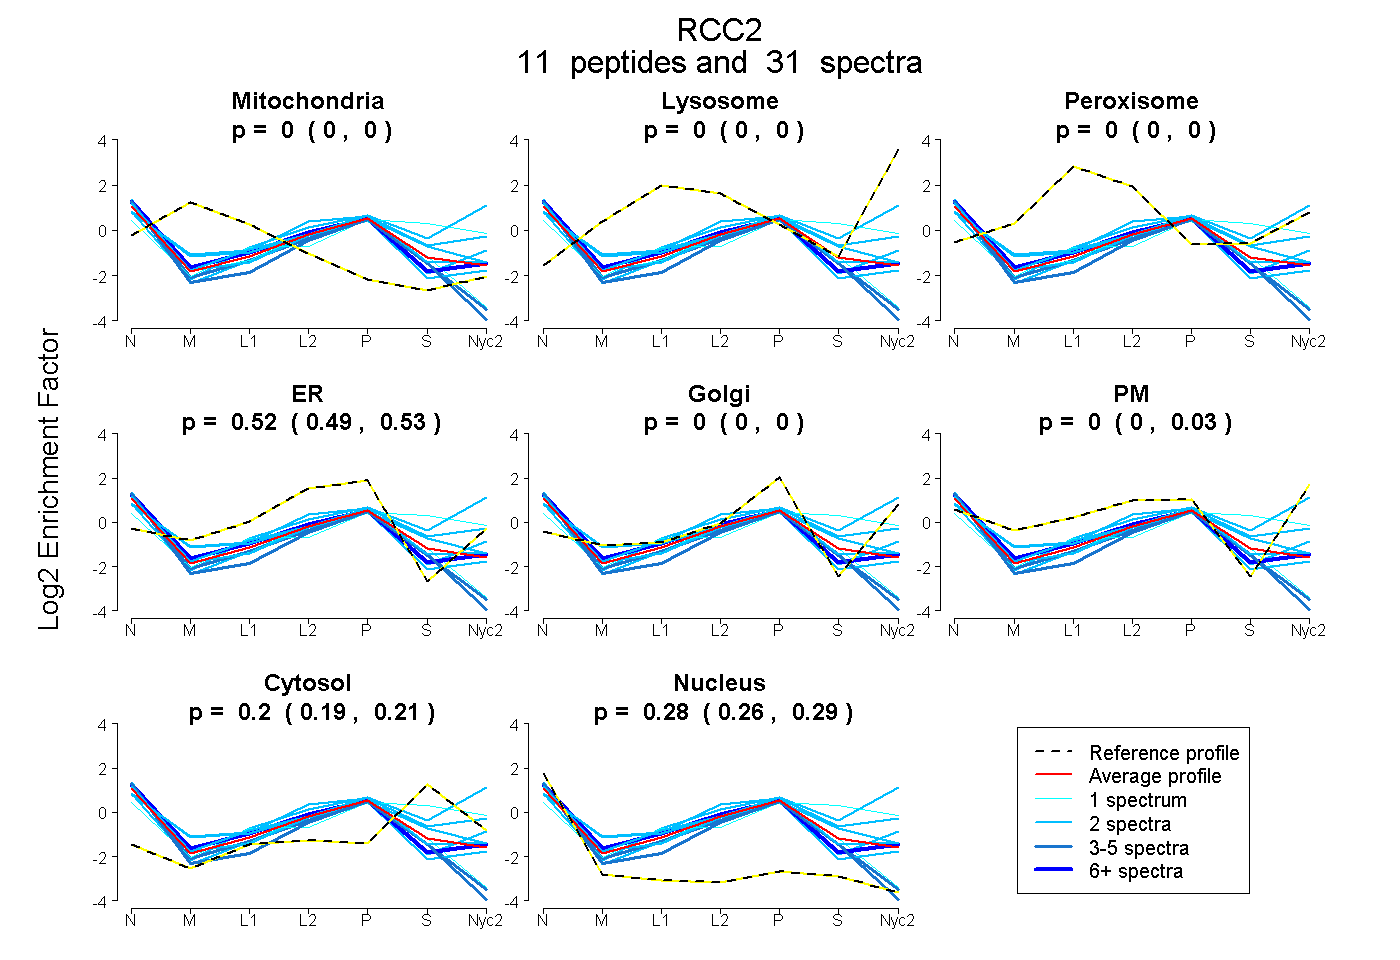
0.000 | 0.000
0.000 | 0.000
0.000 | 0.000
0.487 | 0.528
0.000 | 0.000
0.000 | 0.034
0.187 | 0.213
0.264 | 0.287
4peptides
spectra
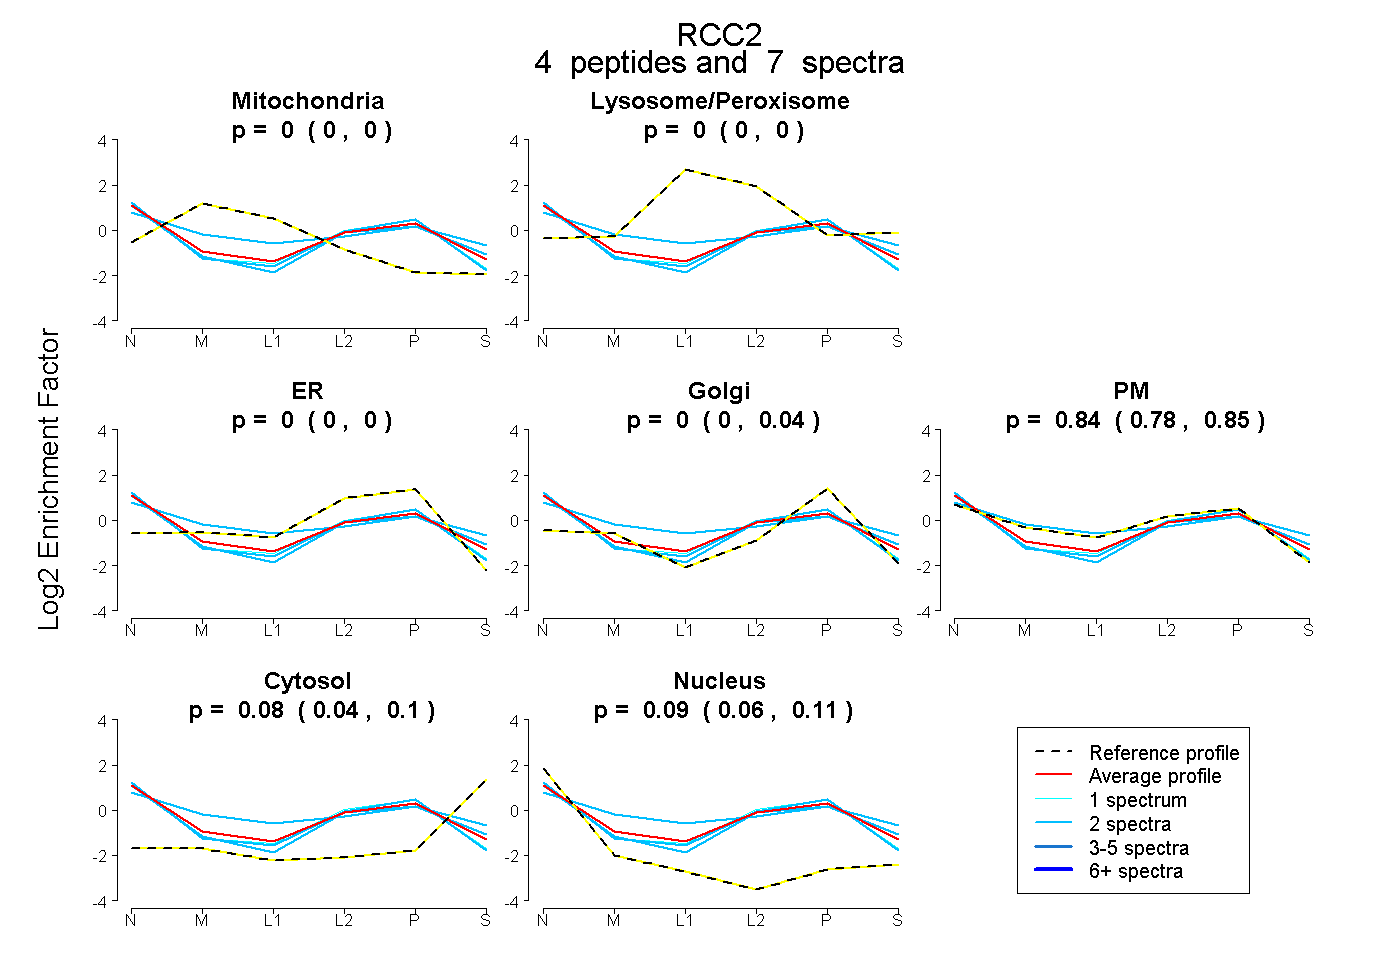
0.000 | 0.000
0.000 | 0.000
0.000 | 0.000
0.000 | 0.041
0.779 | 0.854
0.039 | 0.104
0.061 | 0.109
6peptides
spectra
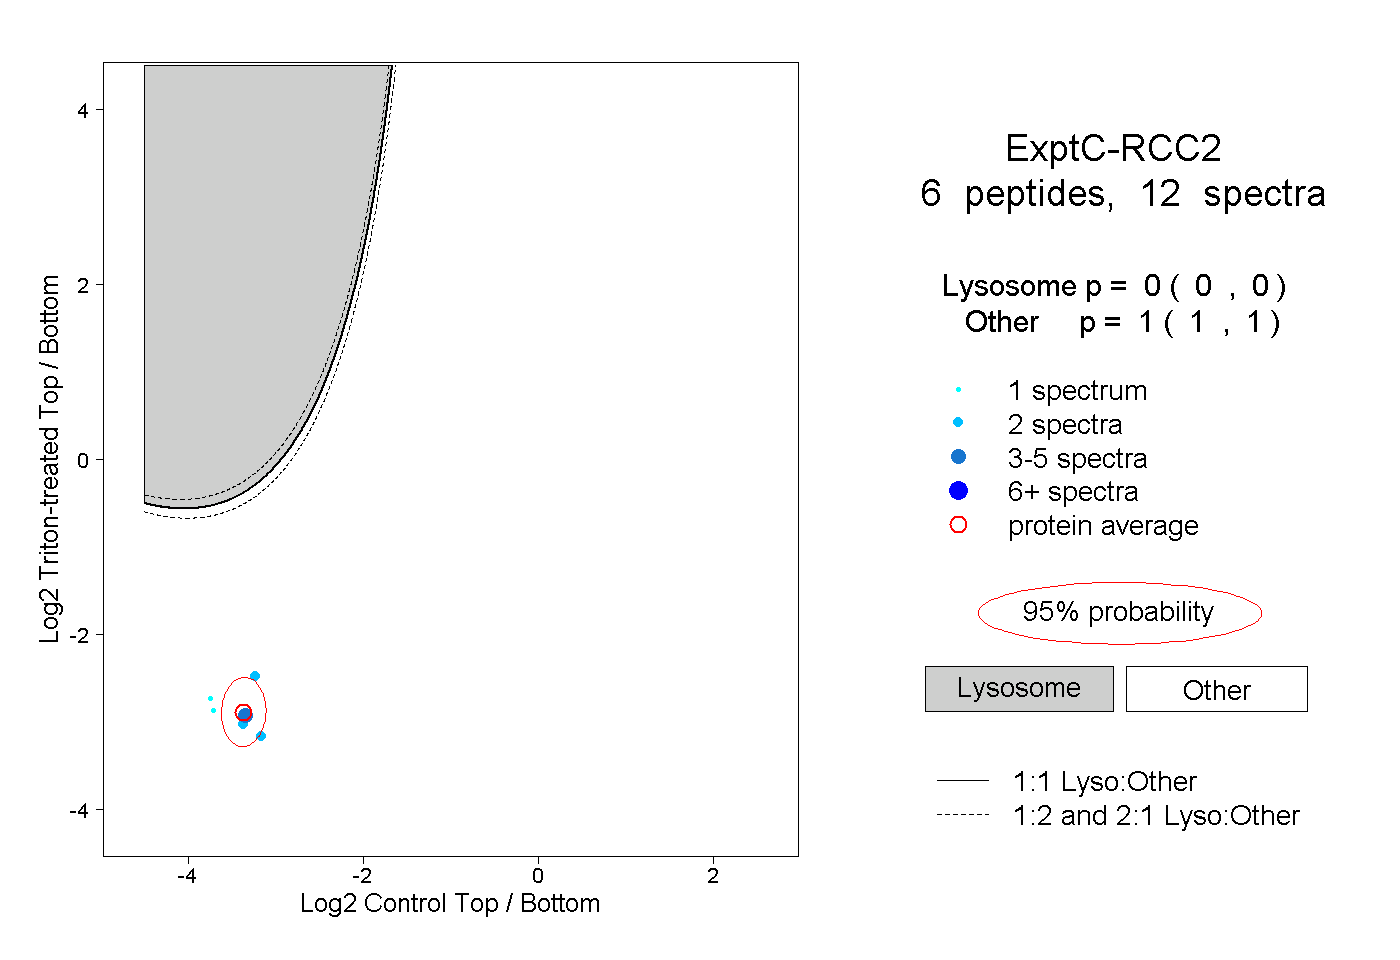
0.000 | 0.000
1.000 | 1.000
2peptides
spectra
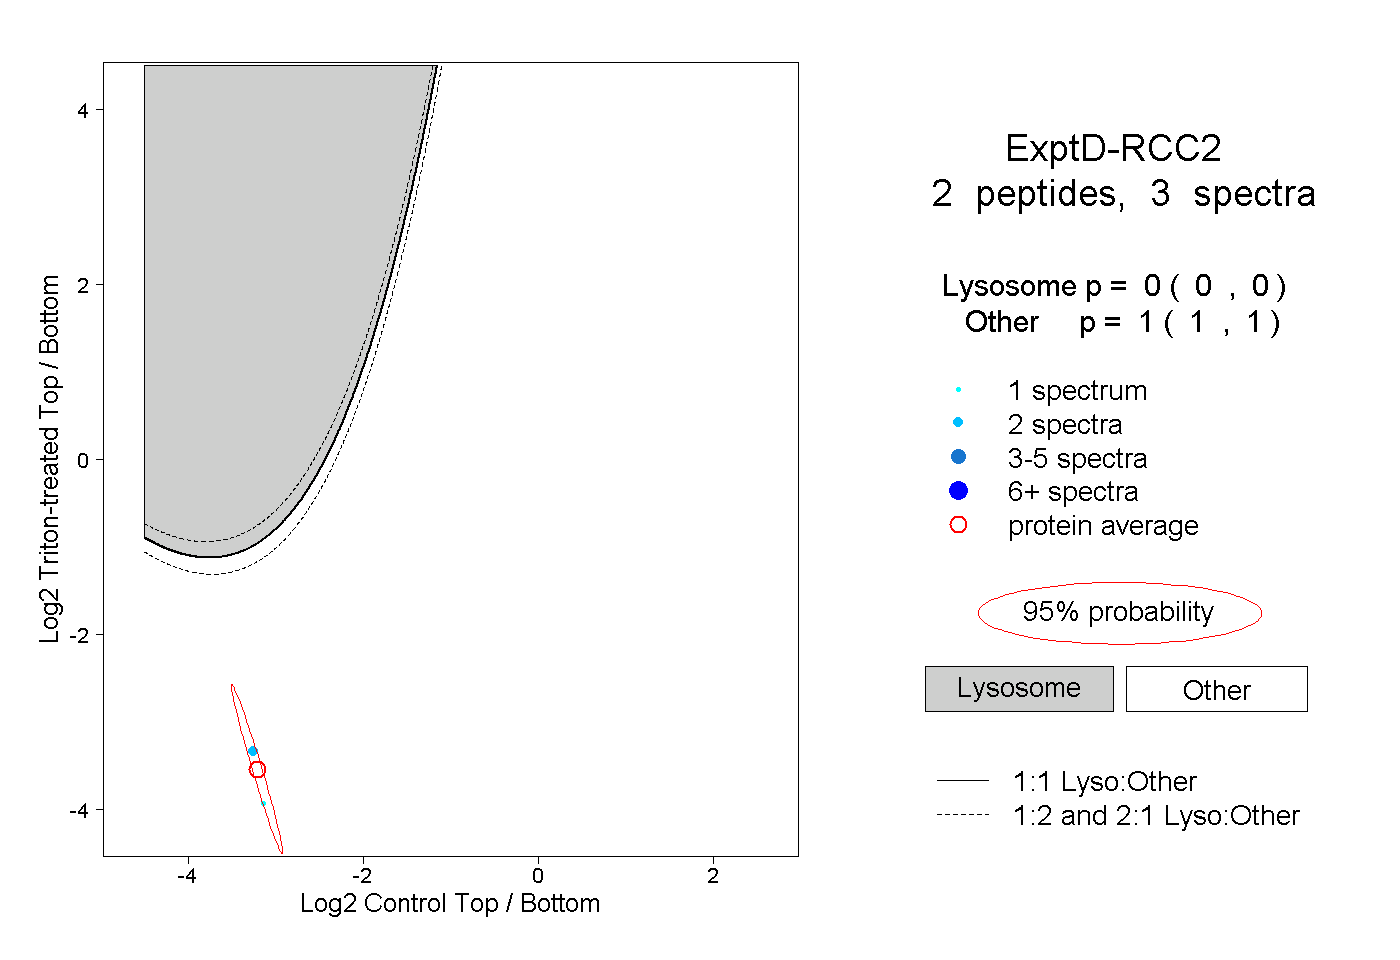
0.000 | 0.000
1.000 | 1.000