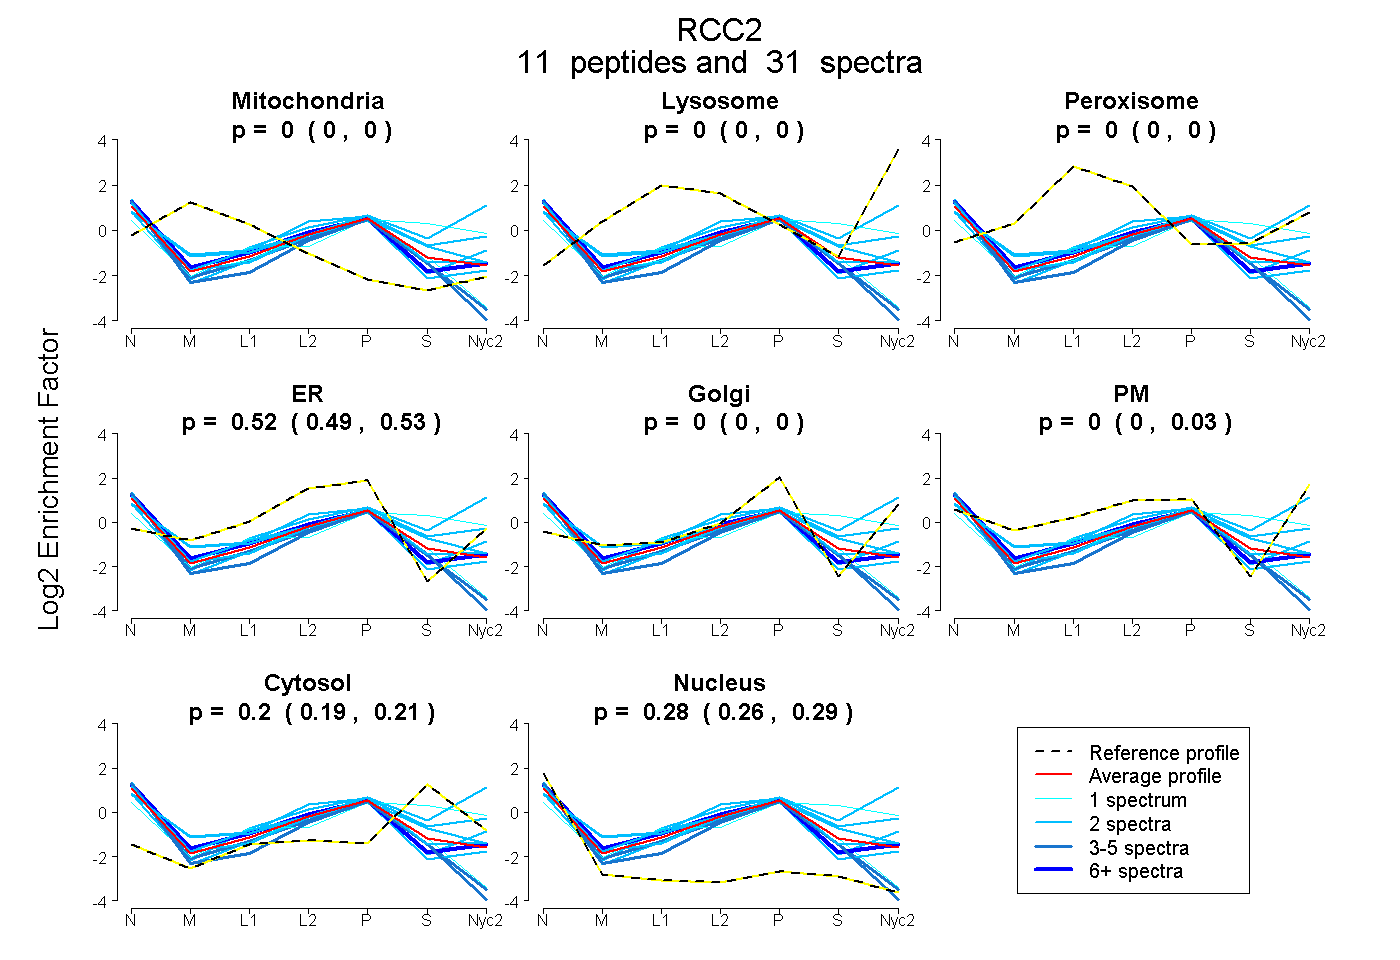
 11
11peptides
spectra
0.000 | 0.000
0.000 | 0.000
0.000 | 0.000
0.487 | 0.528
0.000 | 0.000
0.000 | 0.034
0.187 | 0.213
0.264 | 0.287
| Plot | Mito | Lyso | Perox | ER | Golgi | PM | Cytosol | Nucleus | |||||
| Expt A |
11 peptides |
31 spectra |
|
0.000 0.000 | 0.000 |
0.000 0.000 | 0.000 |
0.000 0.000 | 0.000 |
0.523 0.487 | 0.528 |
0.000 0.000 | 0.000 |
0.000 0.000 | 0.034 |
0.201 0.187 | 0.213 |
0.276 0.264 | 0.287 |
| 2 spectra, LWSWGR | 0.000 | 0.000 | 0.000 | 0.582 | 0.000 | 0.000 | 0.012 | 0.406 | ||
| 2 spectra, YGCLSGVR | 0.000 | 0.000 | 0.000 | 0.506 | 0.000 | 0.076 | 0.144 | 0.274 | ||
| 4 spectra, SSTAAQEVK | 0.000 | 0.000 | 0.000 | 0.417 | 0.000 | 0.000 | 0.051 | 0.532 | ||
| 4 spectra, IEYDCELVPR | 0.000 | 0.000 | 0.000 | 0.470 | 0.000 | 0.000 | 0.062 | 0.469 | ||
| 2 spectra, SLACGK | 0.000 | 0.000 | 0.047 | 0.461 | 0.000 | 0.021 | 0.260 | 0.211 | ||
| 2 spectra, AVQDLCGWR | 0.000 | 0.000 | 0.000 | 0.000 | 0.013 | 0.591 | 0.396 | 0.000 | ||
| 9 spectra, QQAAYR | 0.000 | 0.000 | 0.000 | 0.521 | 0.000 | 0.085 | 0.071 | 0.322 | ||
| 2 spectra, NLGQNLWGPHR | 0.000 | 0.000 | 0.000 | 0.254 | 0.000 | 0.360 | 0.302 | 0.084 | ||
| 1 spectrum, MACGAEFSMLMDCK | 0.000 | 0.000 | 0.000 | 0.000 | 0.144 | 0.278 | 0.549 | 0.029 | ||
| 1 spectrum, LIEALSHEAIVLAACGR | 0.000 | 0.000 | 0.000 | 0.466 | 0.000 | 0.000 | 0.111 | 0.423 | ||
| 2 spectra, GQLGHGDTK | 0.000 | 0.000 | 0.000 | 0.306 | 0.126 | 0.173 | 0.071 | 0.324 |
| Plot | Mito | Lyso or Perox | ER | Golgi | PM | Cytosol | Nucleus | ||||||
| Expt B |
4 peptides |
7 spectra |
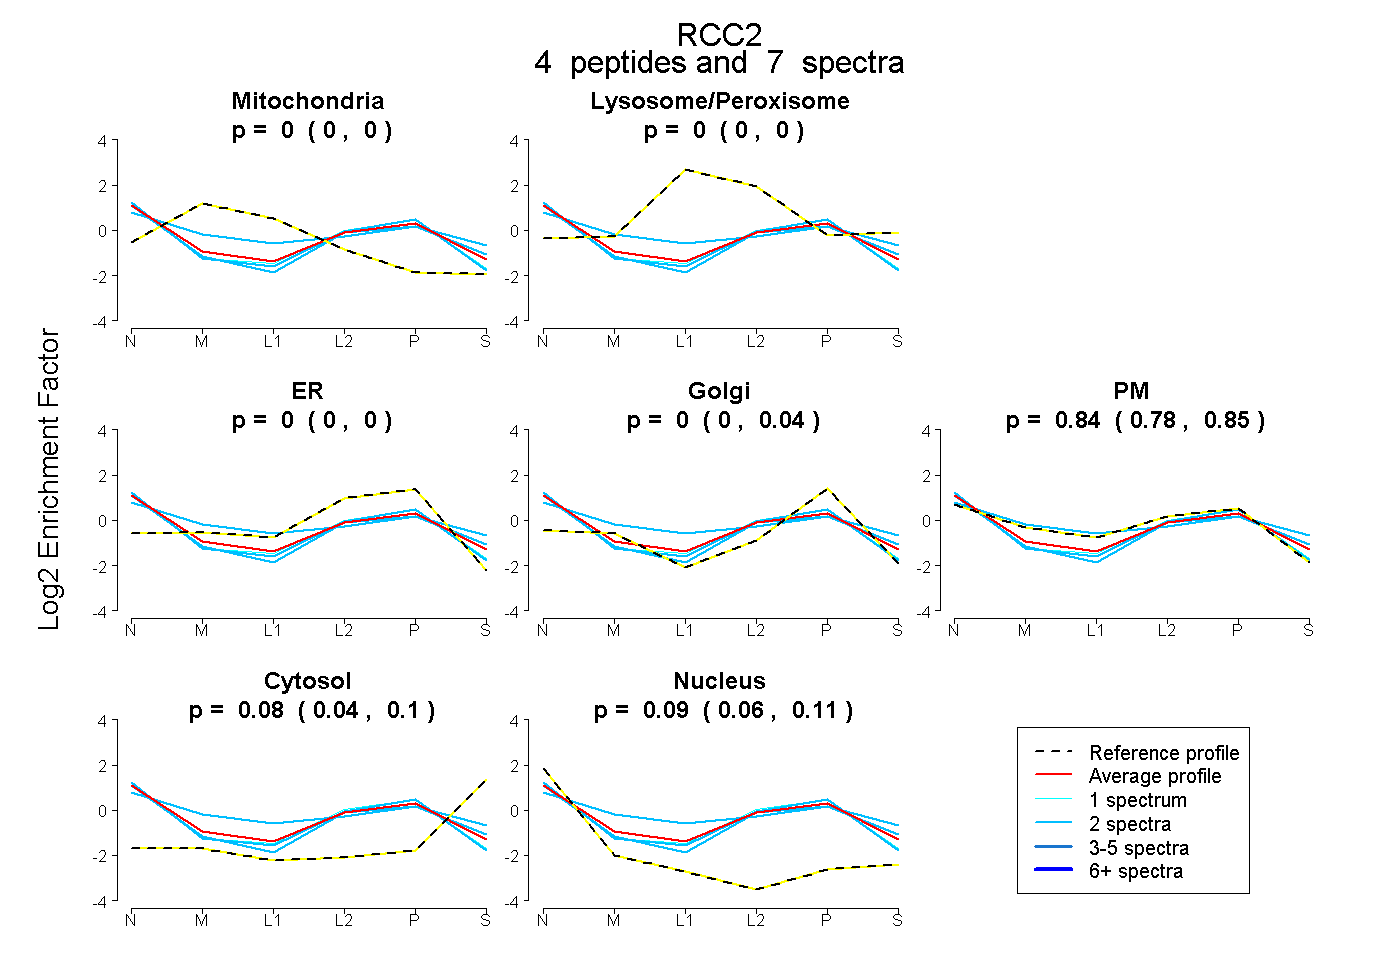 |
0.000 0.000 | 0.000 |
0.000 0.000 | 0.000 |
0.000 0.000 | 0.000 |
0.000 0.000 | 0.041 |
0.836 0.779 | 0.854 |
0.077 0.039 | 0.104 |
0.087 0.061 | 0.109 |
|||
| Plot | Lyso | Other | |||||||||||
| Expt C |
6 peptides |
12 spectra |
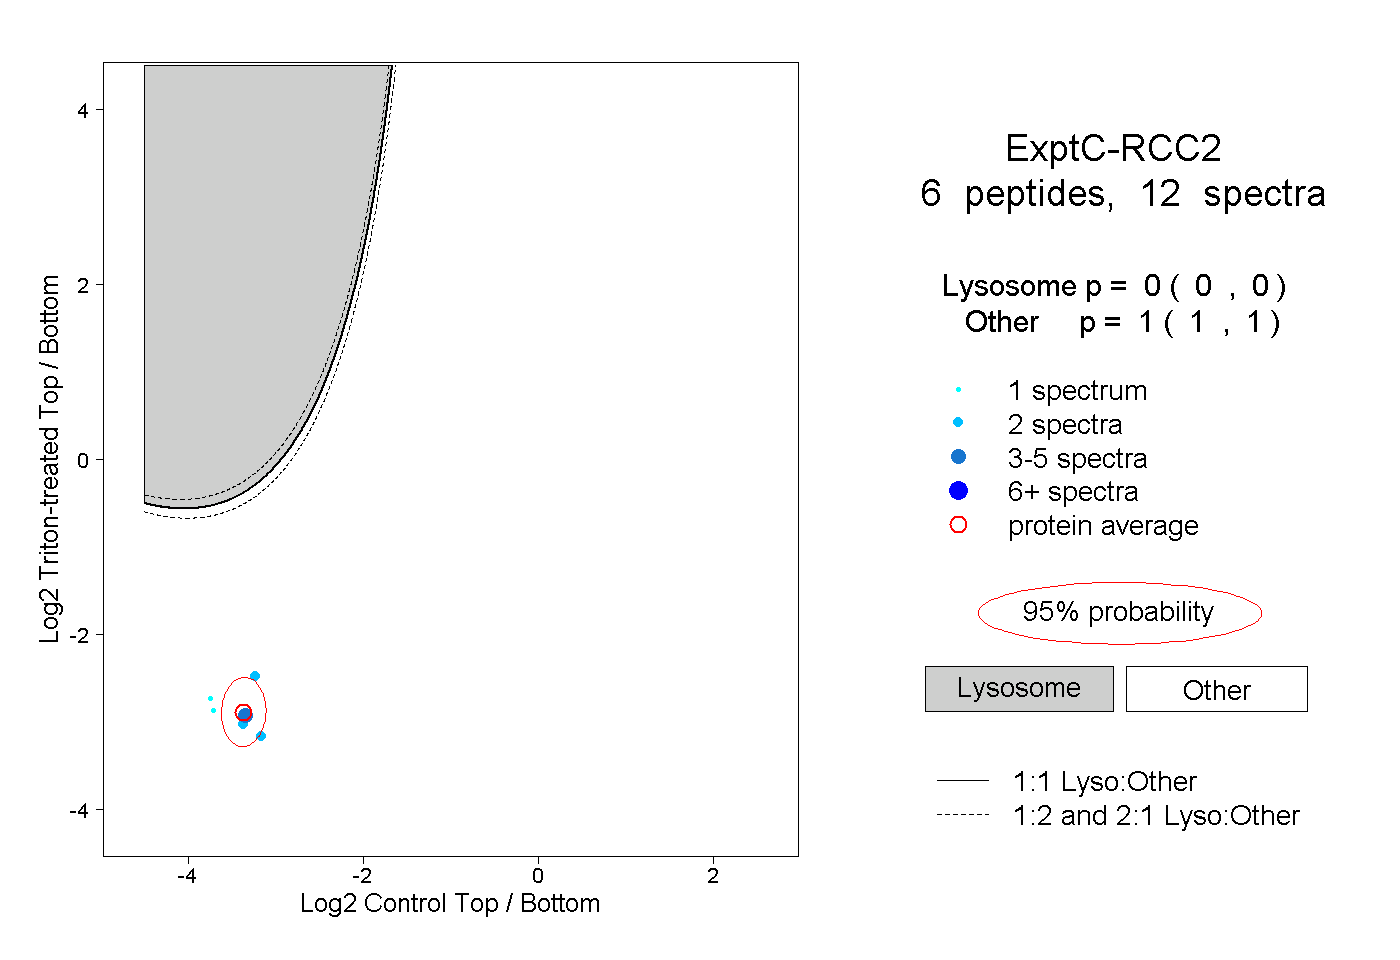 |
0.000 0.000 | 0.000 |
1.000 1.000 | 1.000 |
||||||||
| Plot | Lyso | Other | |||||||||||
| Expt D |
2 peptides |
3 spectra |
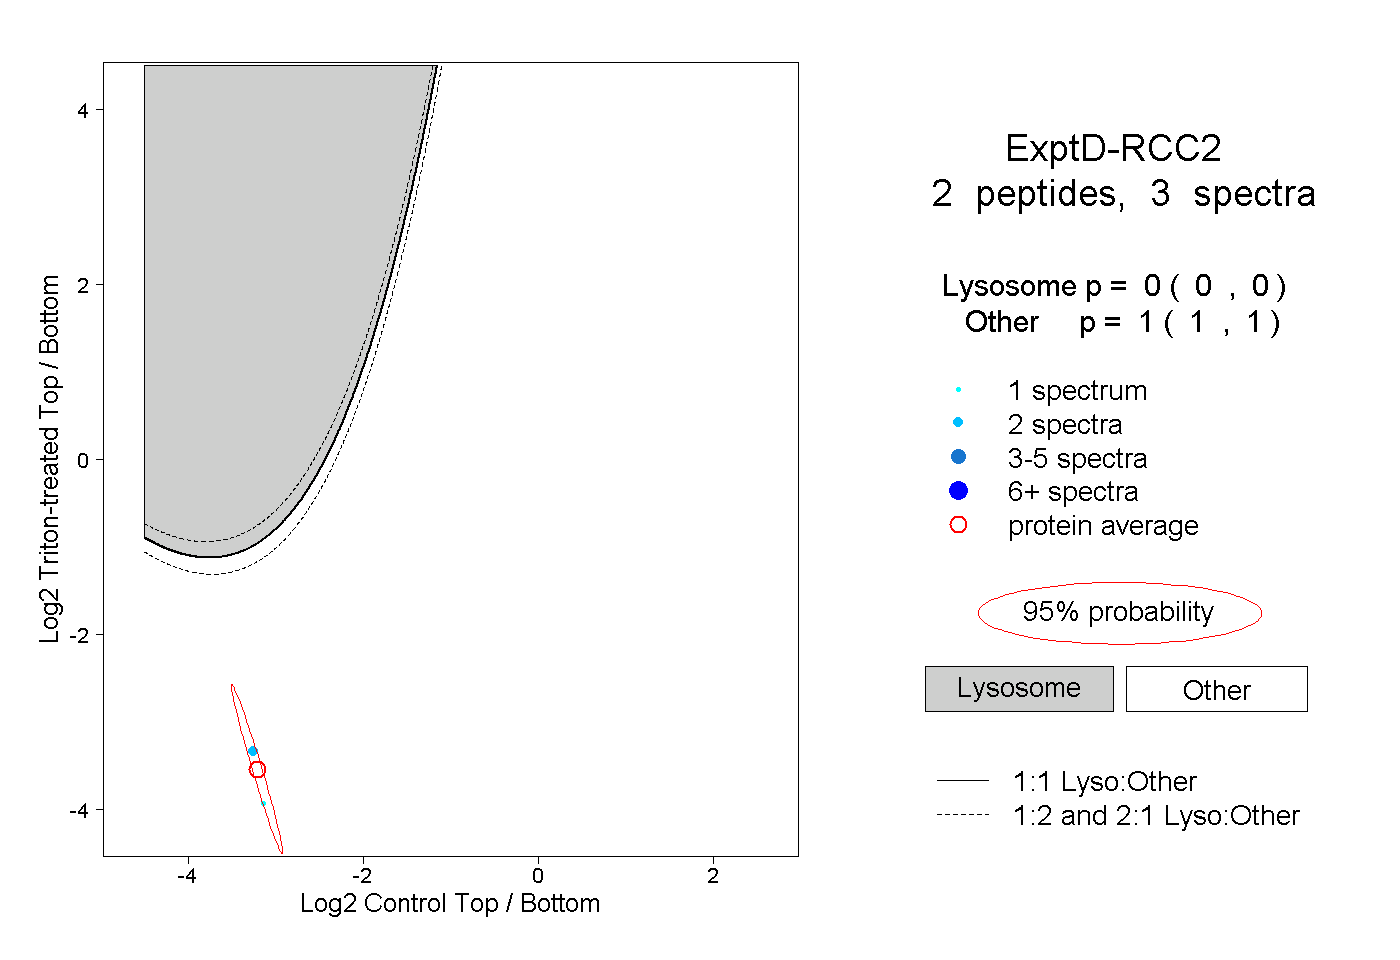 |
0.000 0.000 | 0.000 |
1.000 1.000 | 1.000 |