 11
11peptides
spectra
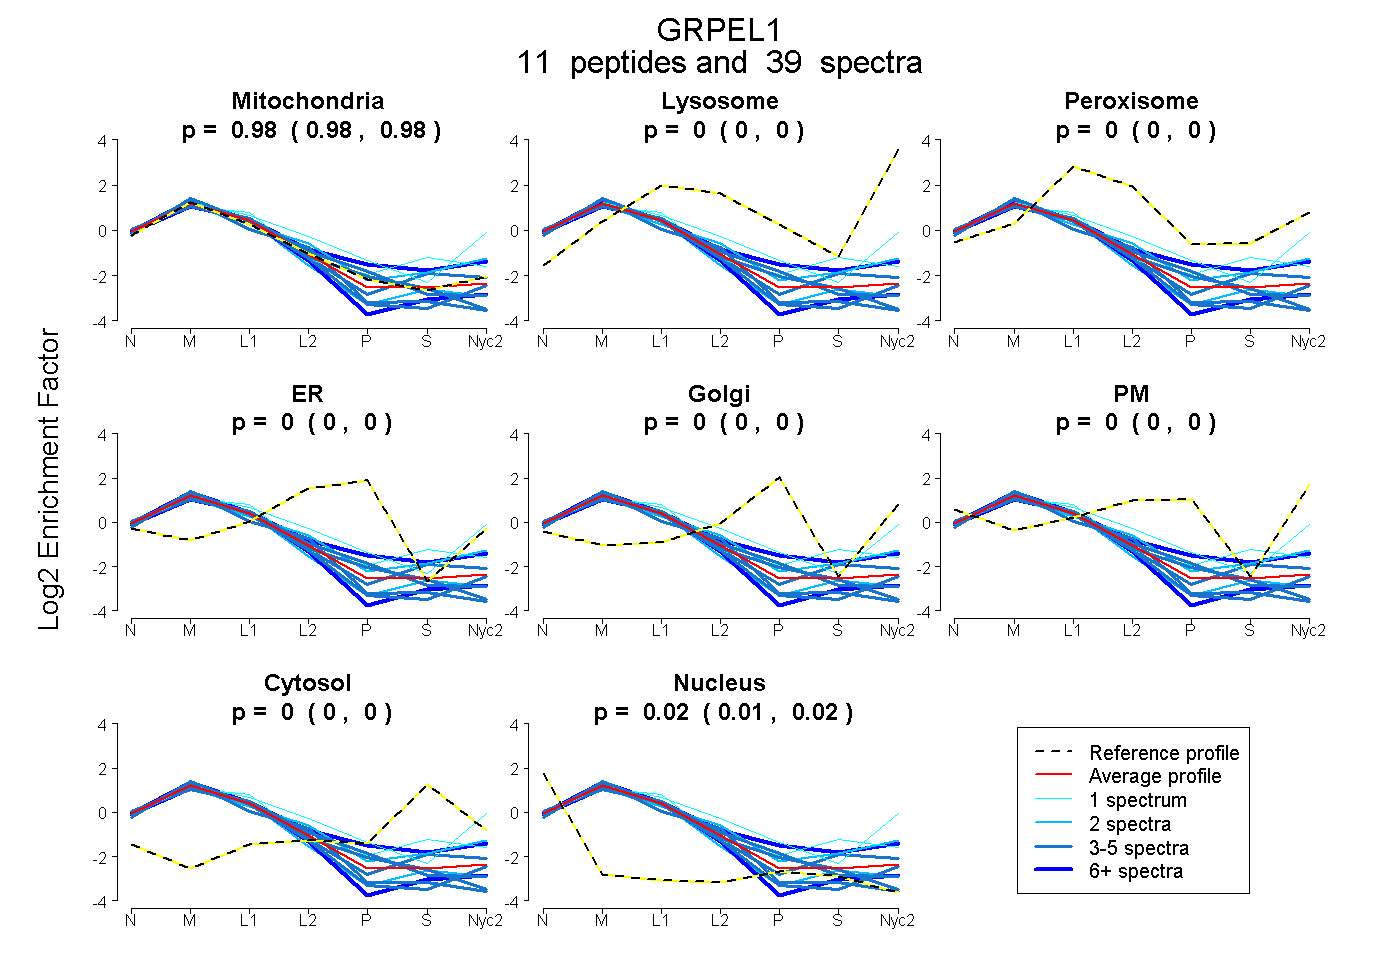
0.976 | 0.984
0.000 | 0.000
0.000 | 0.000
0.000 | 0.000
0.000 | 0.000
0.000 | 0.000
0.000 | 0.000
0.015 | 0.023
10peptides
spectra
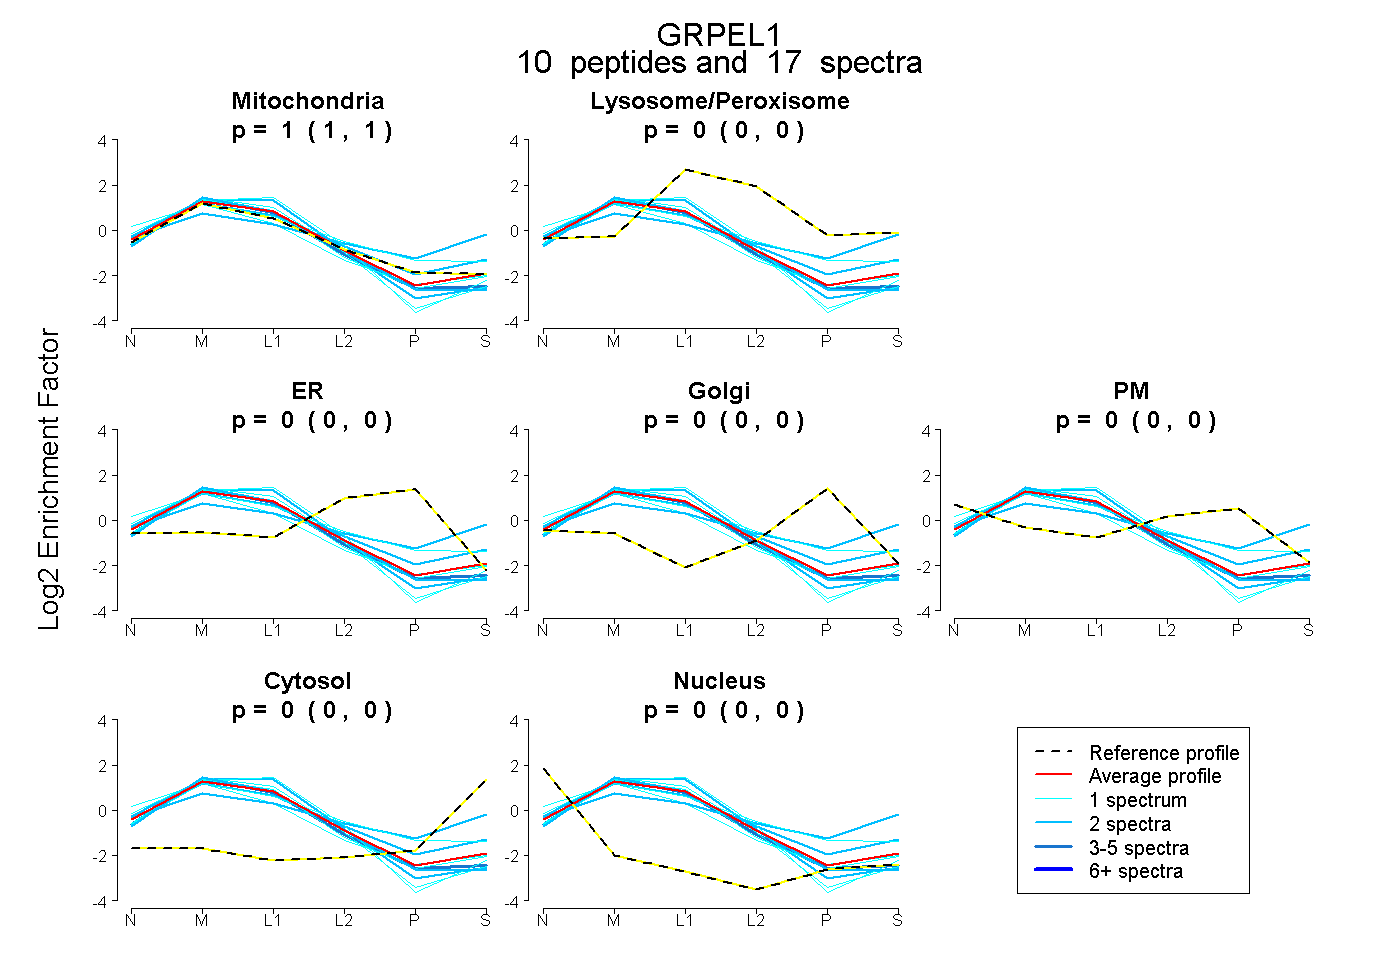
1.000 | 1.000
0.000 | 0.000
0.000 | 0.000
0.000 | 0.000
0.000 | 0.000
0.000 | 0.000
0.000 | 0.000
11peptides
spectra
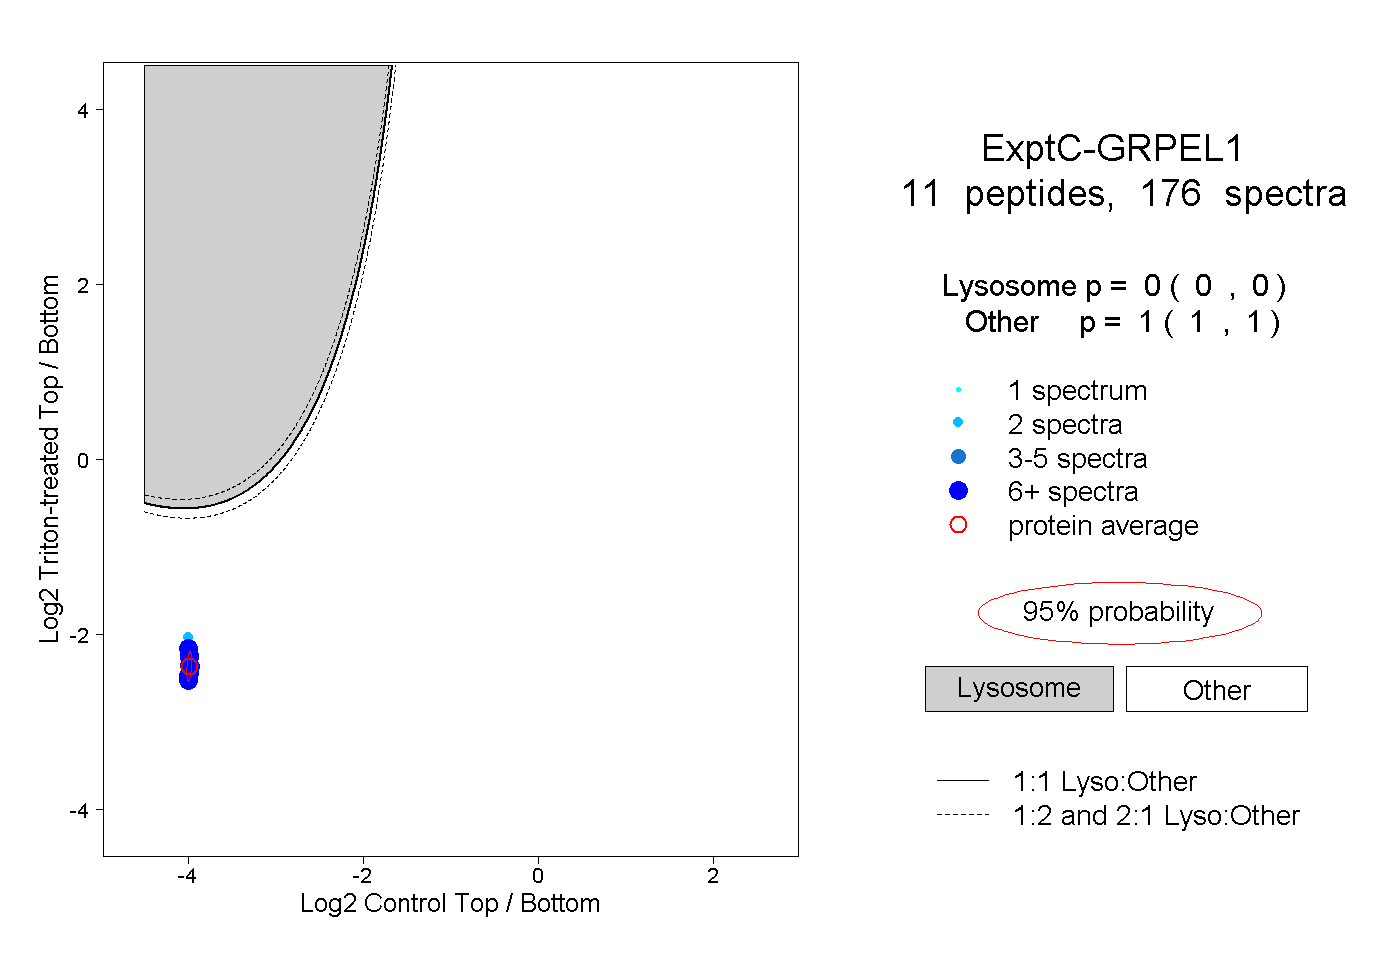
0.000 | 0.000
1.000 | 1.000
7peptides
spectra
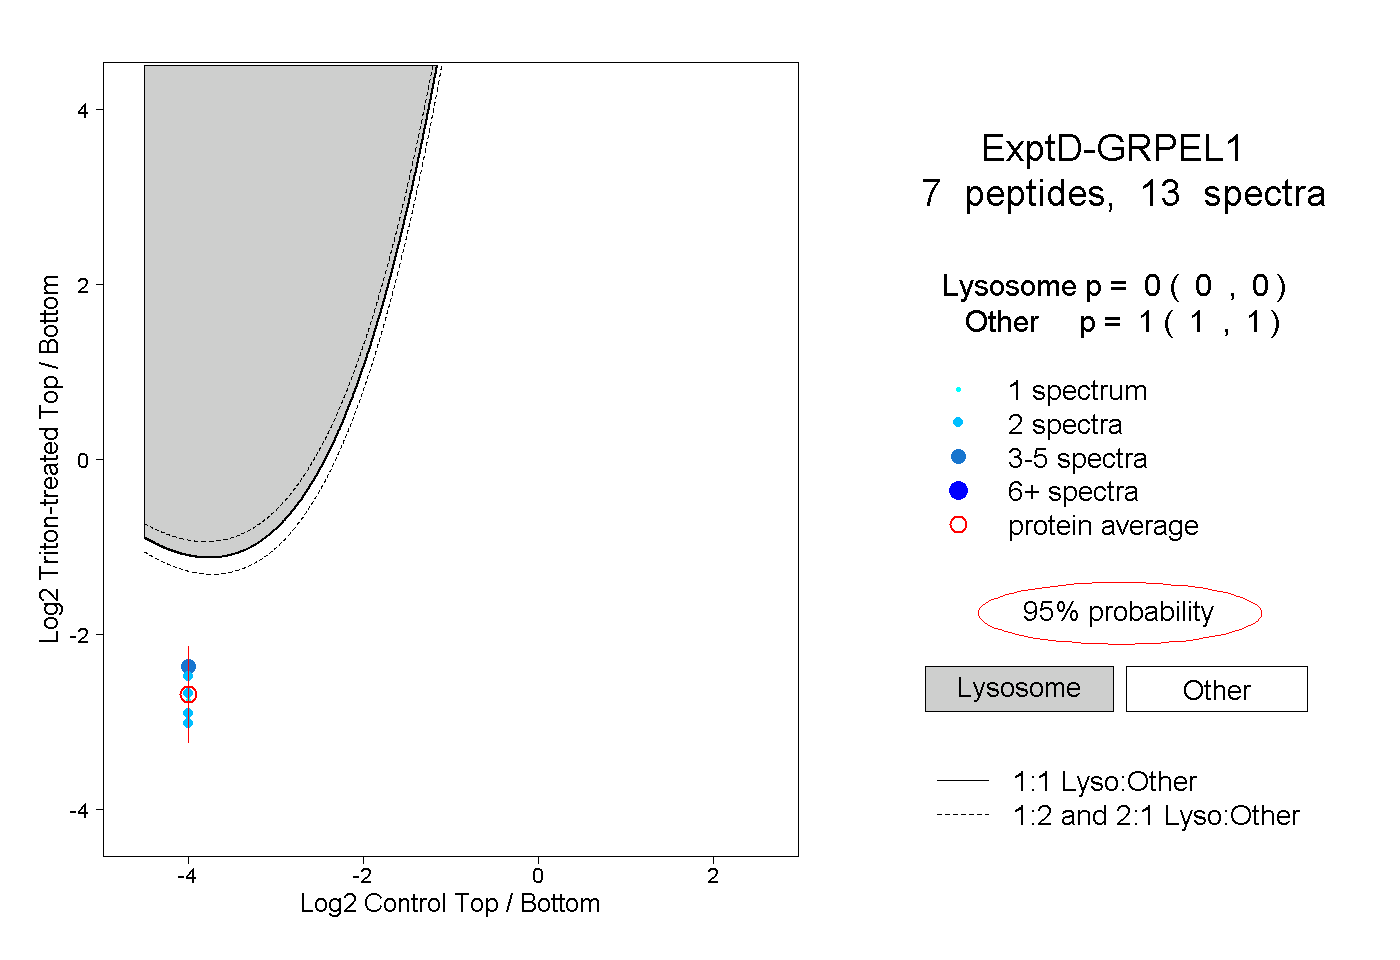
0.000 | 0.000
1.000 | 1.000