 11
11peptides
spectra
0.976 | 0.984
0.000 | 0.000
0.000 | 0.000
0.000 | 0.000
0.000 | 0.000
0.000 | 0.000
0.000 | 0.000
0.015 | 0.023
| Plot | Mito | Lyso | Perox | ER | Golgi | PM | Cytosol | Nucleus | |||||
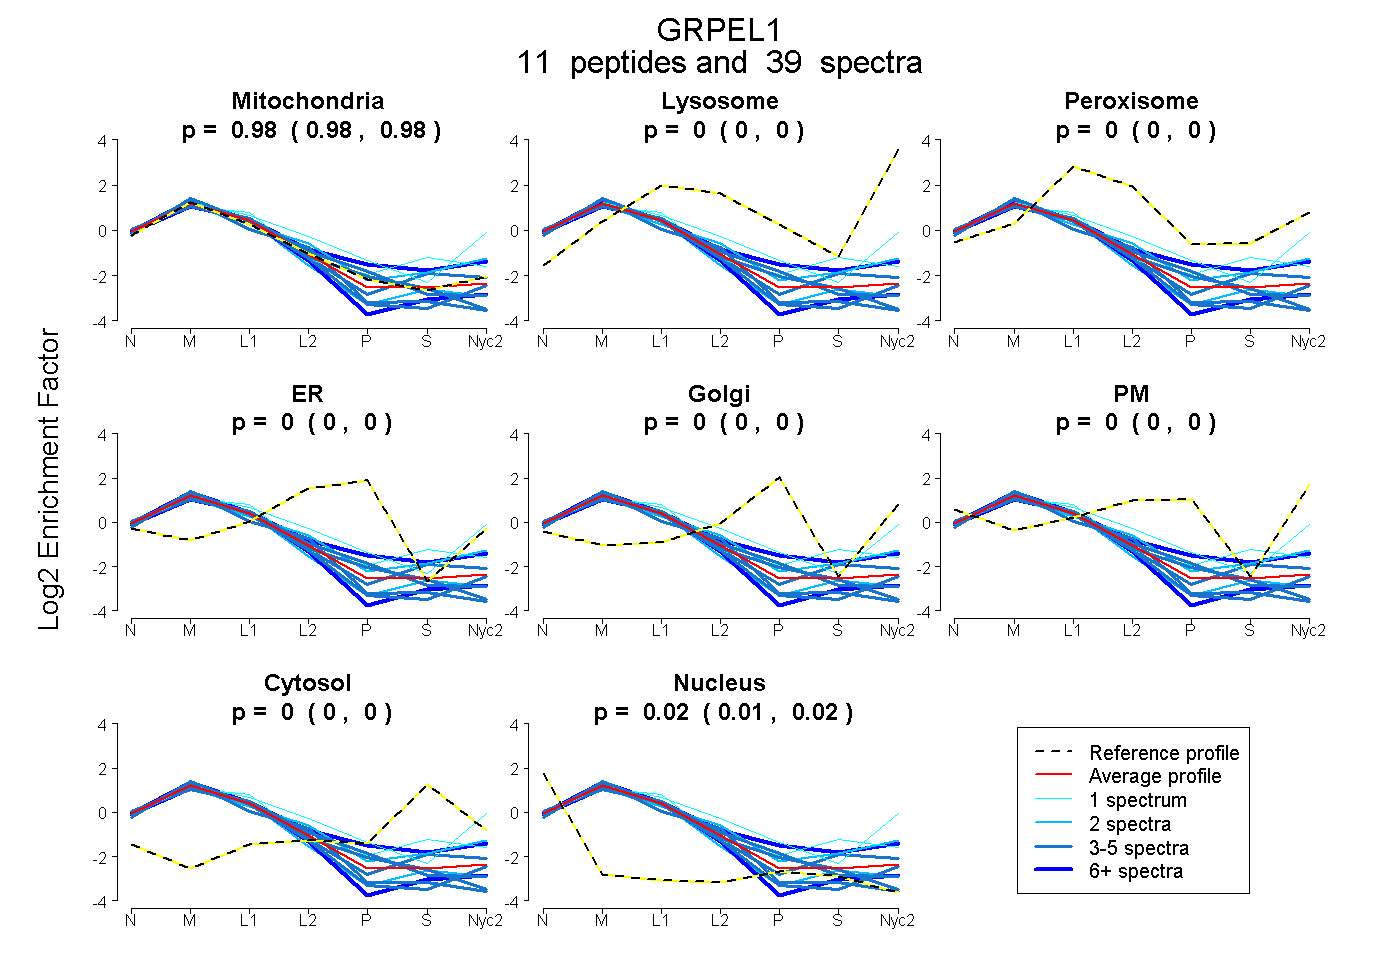
| Expt A |
11 peptides |
39 spectra |
|
0.981 0.976 | 0.984 |
0.000 0.000 | 0.000 |
0.000 0.000 | 0.000 |
0.000 0.000 | 0.000 |
0.000 0.000 | 0.000 |
0.000 0.000 | 0.000 |
0.000 0.000 | 0.000 |
0.019 0.015 | 0.023 |
| 7 spectra, DLLEVADILEK | 0.745 | 0.000 | 0.123 | 0.000 | 0.019 | 0.042 | 0.070 | 0.000 | ||
| 1 spectrum, TDPSSADK | 0.653 | 0.241 | 0.000 | 0.000 | 0.000 | 0.106 | 0.000 | 0.000 | ||
| 3 spectra, SLYEGLVMTEVQIQK | 0.915 | 0.000 | 0.000 | 0.000 | 0.000 | 0.000 | 0.000 | 0.085 | ||
| 2 spectra, EPGTVALVSK | 0.923 | 0.000 | 0.000 | 0.000 | 0.000 | 0.000 | 0.000 | 0.077 | ||
| 4 spectra, ALADTENLR | 0.942 | 0.000 | 0.000 | 0.000 | 0.000 | 0.000 | 0.058 | 0.000 | ||
| 3 spectra, NNGQNLEEDLGHCEPK | 0.924 | 0.000 | 0.000 | 0.000 | 0.000 | 0.000 | 0.000 | 0.076 | ||
| 5 spectra, LYGIQGFCK | 0.952 | 0.000 | 0.000 | 0.014 | 0.000 | 0.000 | 0.000 | 0.034 | ||
| 2 spectra, EEVSNNNPHLK | 0.780 | 0.025 | 0.123 | 0.000 | 0.000 | 0.000 | 0.058 | 0.014 | ||
| 6 spectra, FDPYEHEALFHTPVEGK | 0.945 | 0.000 | 0.000 | 0.000 | 0.000 | 0.000 | 0.000 | 0.055 | ||
| 1 spectrum, LDPIGAK | 0.751 | 0.000 | 0.123 | 0.000 | 0.000 | 0.000 | 0.126 | 0.000 | ||
| 5 spectra, TLRPALVGVVK | 0.977 | 0.000 | 0.000 | 0.000 | 0.000 | 0.000 | 0.000 | 0.023 |
| Plot | Mito | Lyso or Perox | ER | Golgi | PM | Cytosol | Nucleus | ||||||
| Expt B |
10 peptides |
17 spectra |
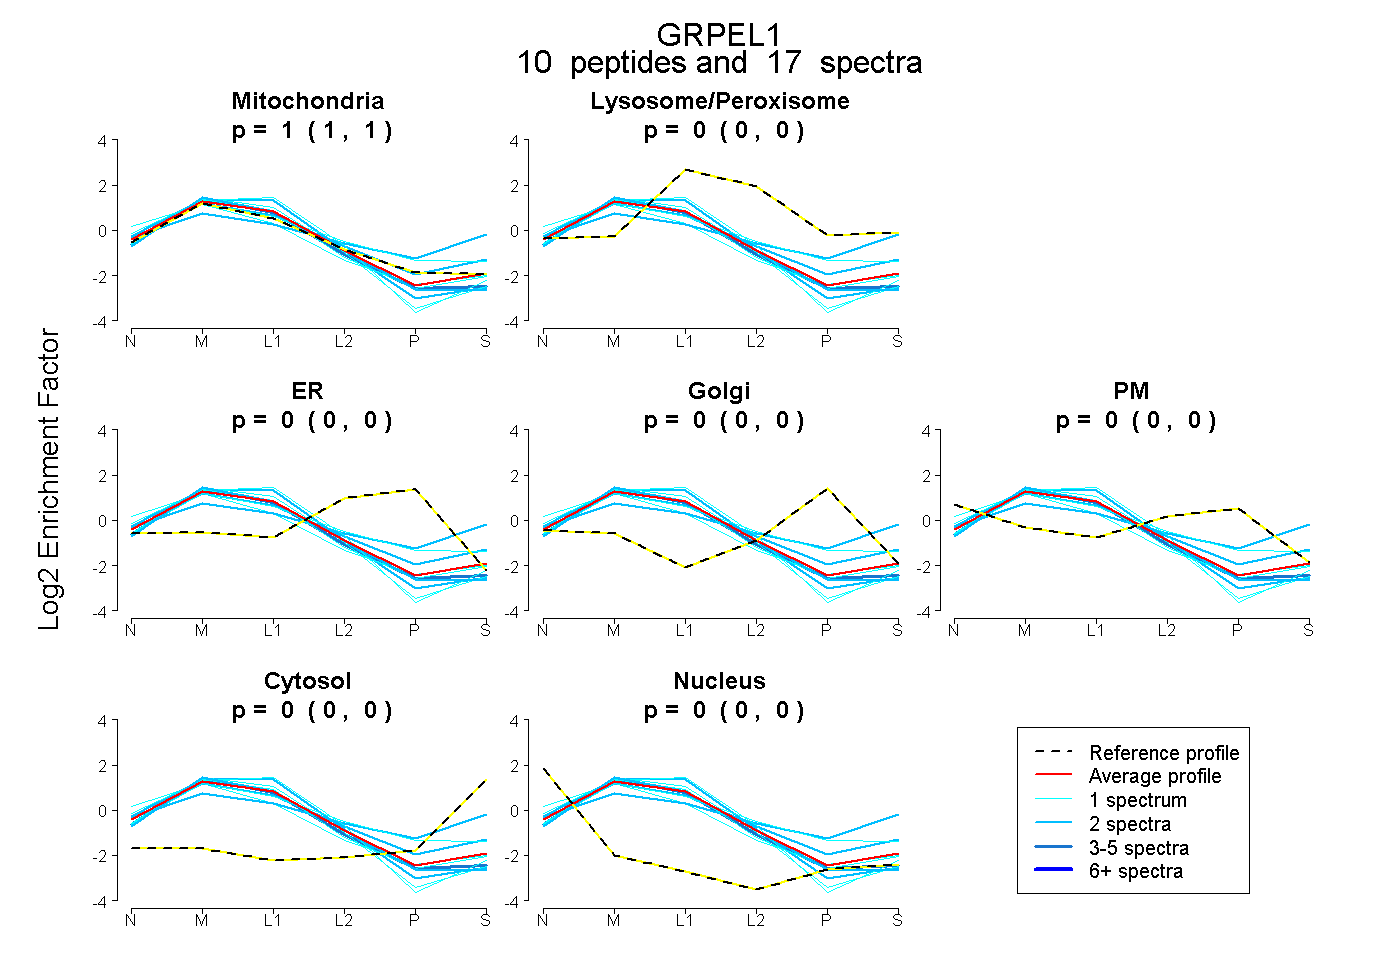 |
1.000 1.000 | 1.000 |
0.000 0.000 | 0.000 |
0.000 0.000 | 0.000 |
0.000 0.000 | 0.000 |
0.000 0.000 | 0.000 |
0.000 0.000 | 0.000 |
0.000 0.000 | 0.000 |
|||
| Plot | Lyso | Other | |||||||||||
| Expt C |
11 peptides |
176 spectra |
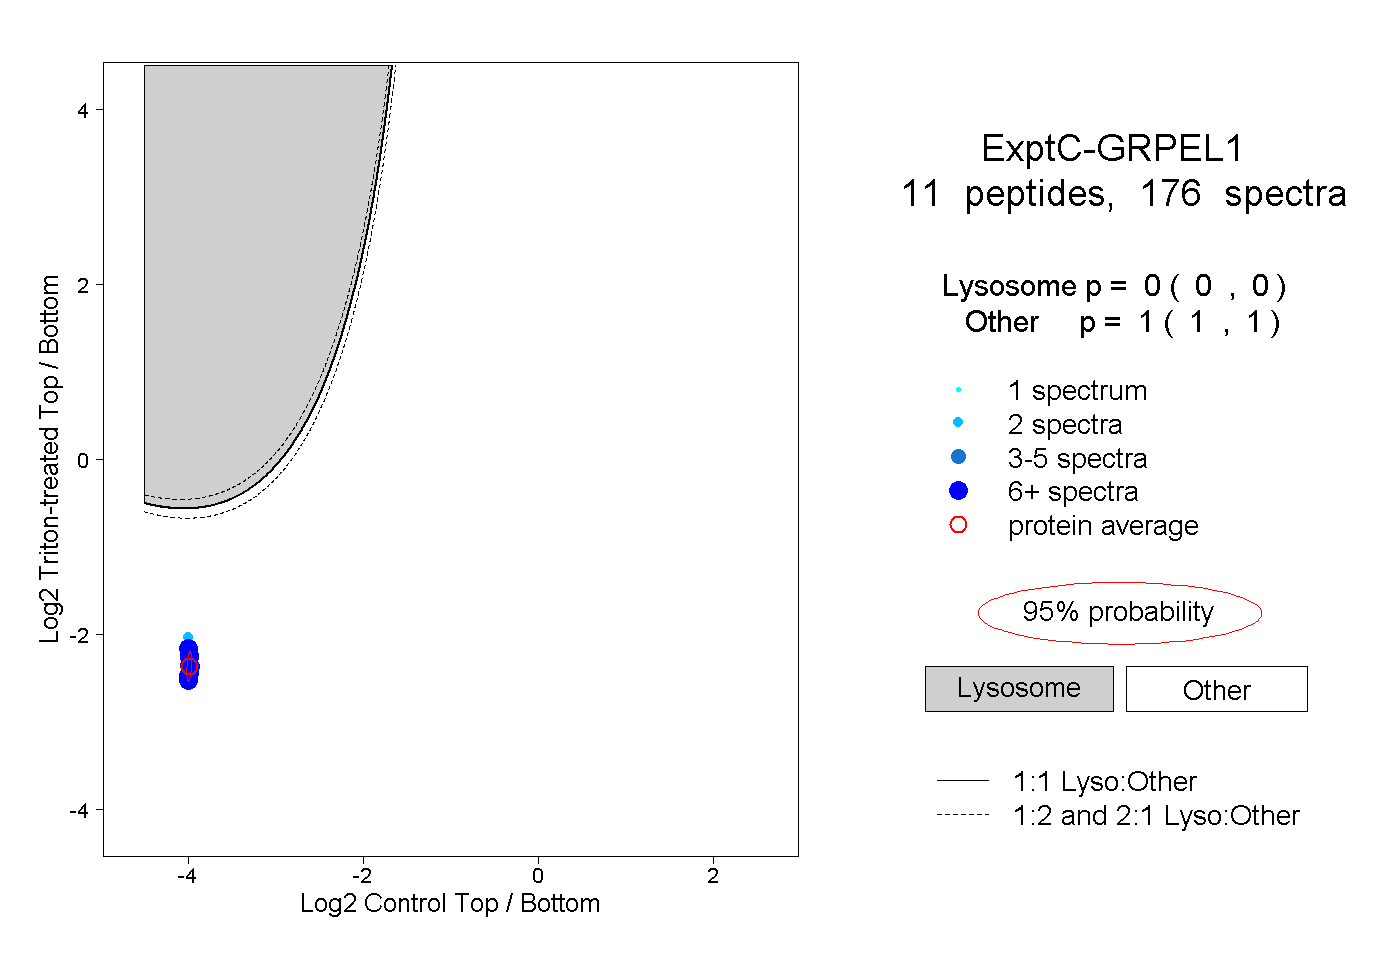 |
0.000 0.000 | 0.000 |
1.000 1.000 | 1.000 |
||||||||
| Plot | Lyso | Other | |||||||||||
| Expt D |
7 peptides |
13 spectra |
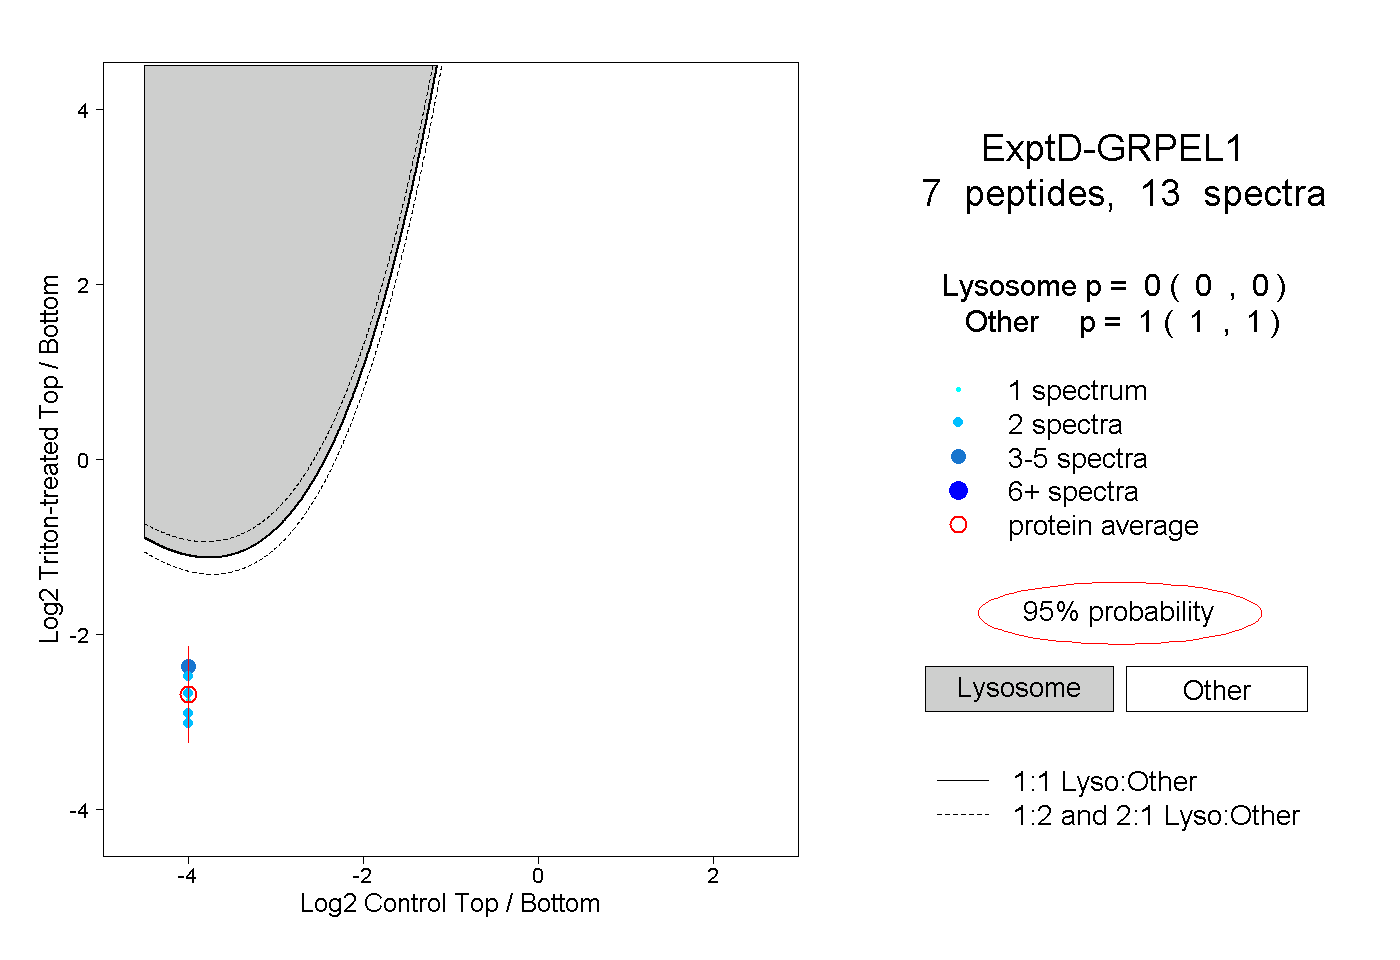 |
0.000 0.000 | 0.000 |
1.000 1.000 | 1.000 |