 5
5peptides
spectra
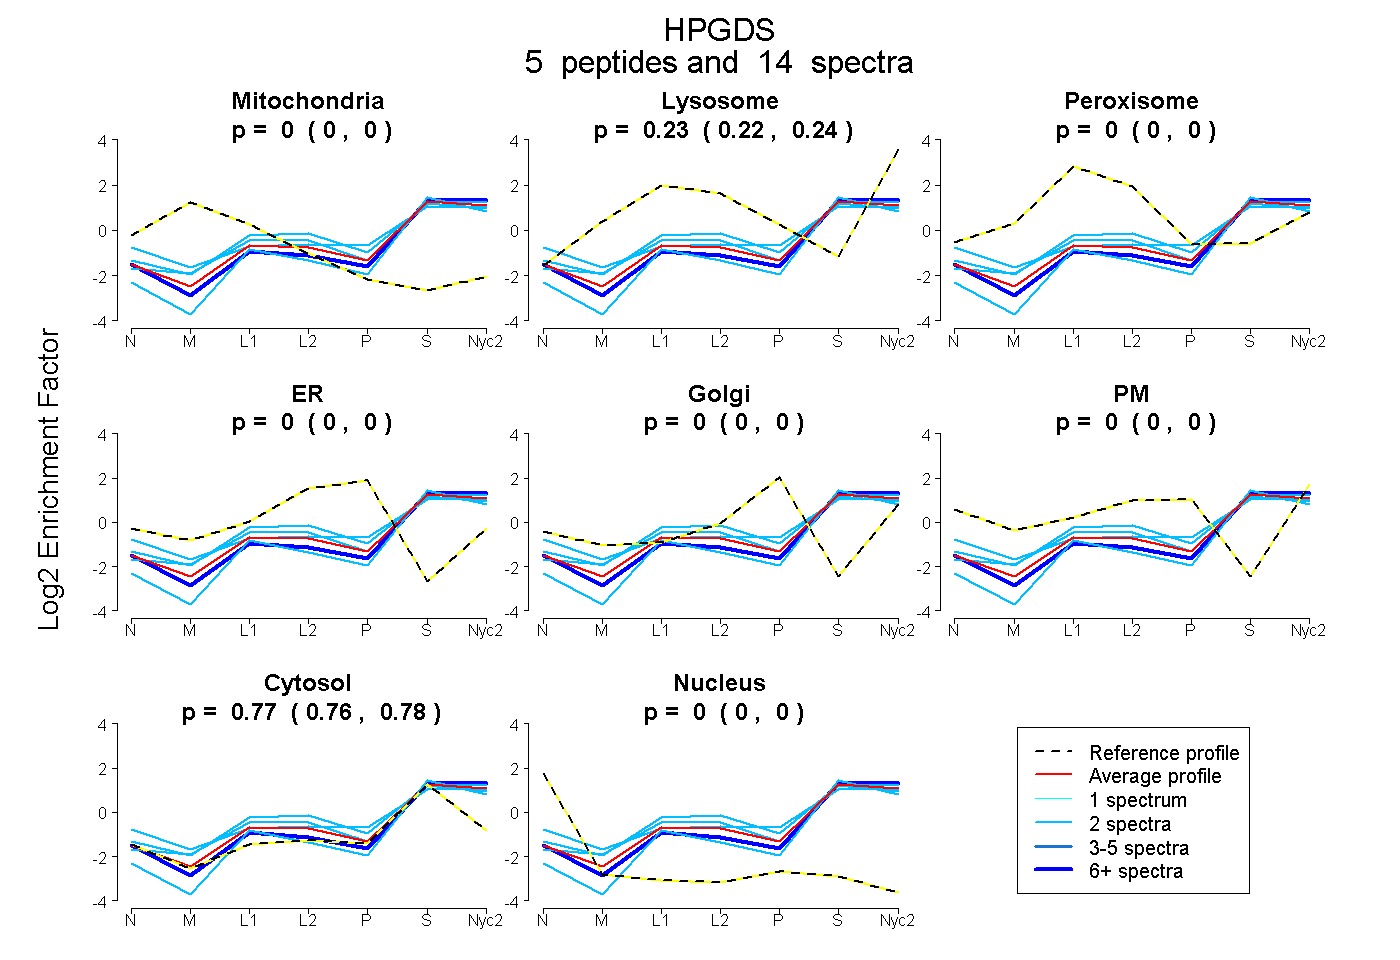
0.000 | 0.000
0.216 | 0.239
0.000 | 0.000
0.000 | 0.000
0.000 | 0.000
0.000 | 0.000
0.758 | 0.782
0.000 | 0.000
1peptide
spectra
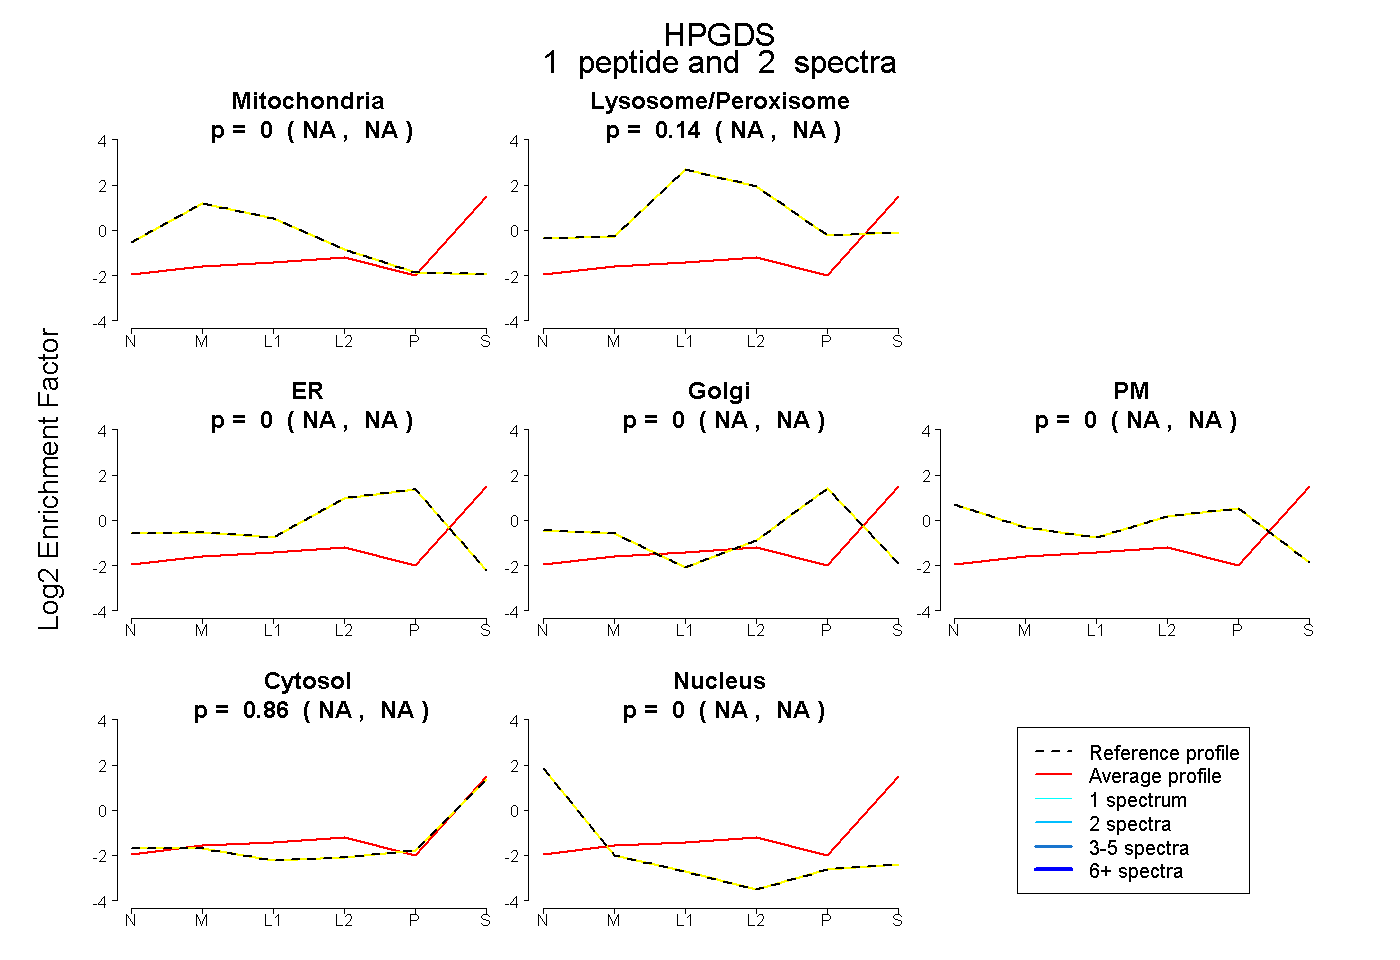
NA | NA
NA | NA
NA | NA
NA | NA
NA | NA
NA | NA
NA | NA
5peptides
spectra
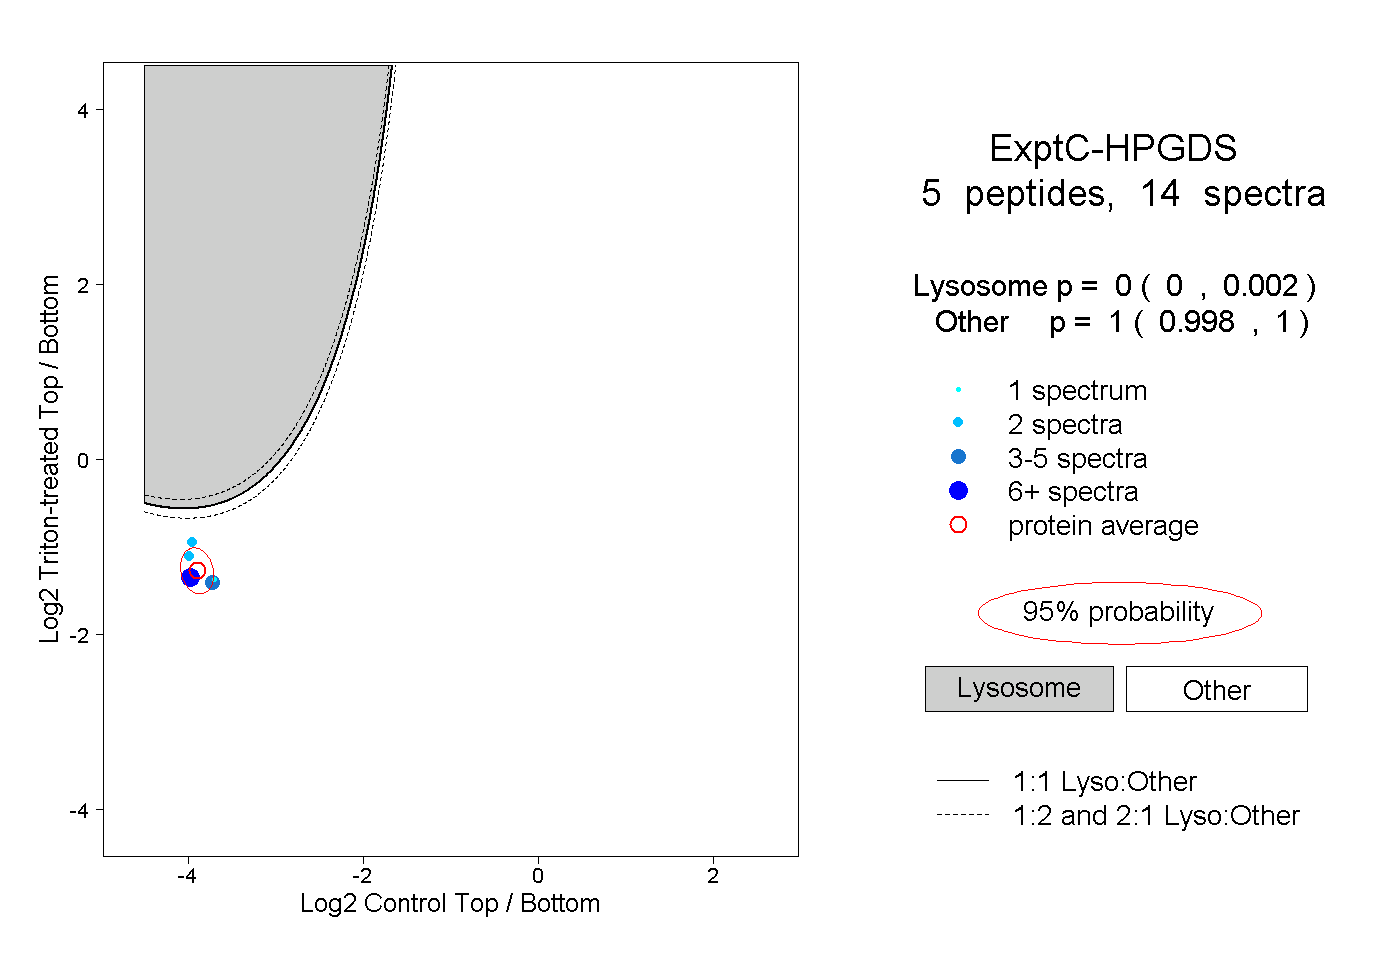
0.000 | 0.002
0.998 | 1.000
1peptide
spectrum
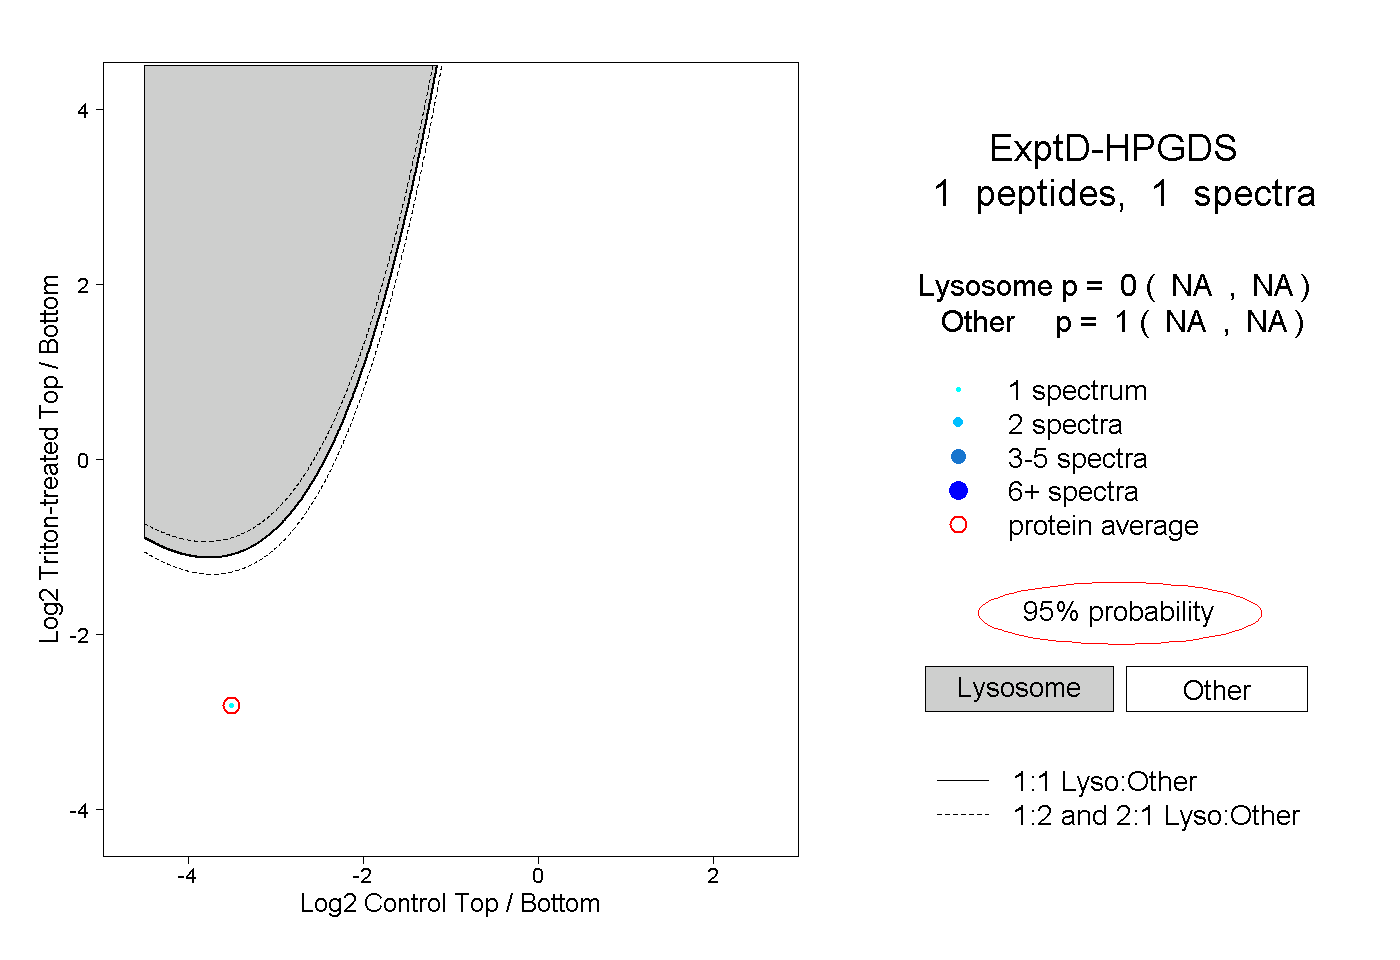
NA | NA
NA | NA