HPGDS
[ENSRNOP00000008826]
Main page
| | | Plot |
Mito |
Lyso |
|
Perox |
ER |
Golgi |
PM |
Cytosol |
Nucleus |
|
| Expt A |
 5
5
peptides |
14
spectra |
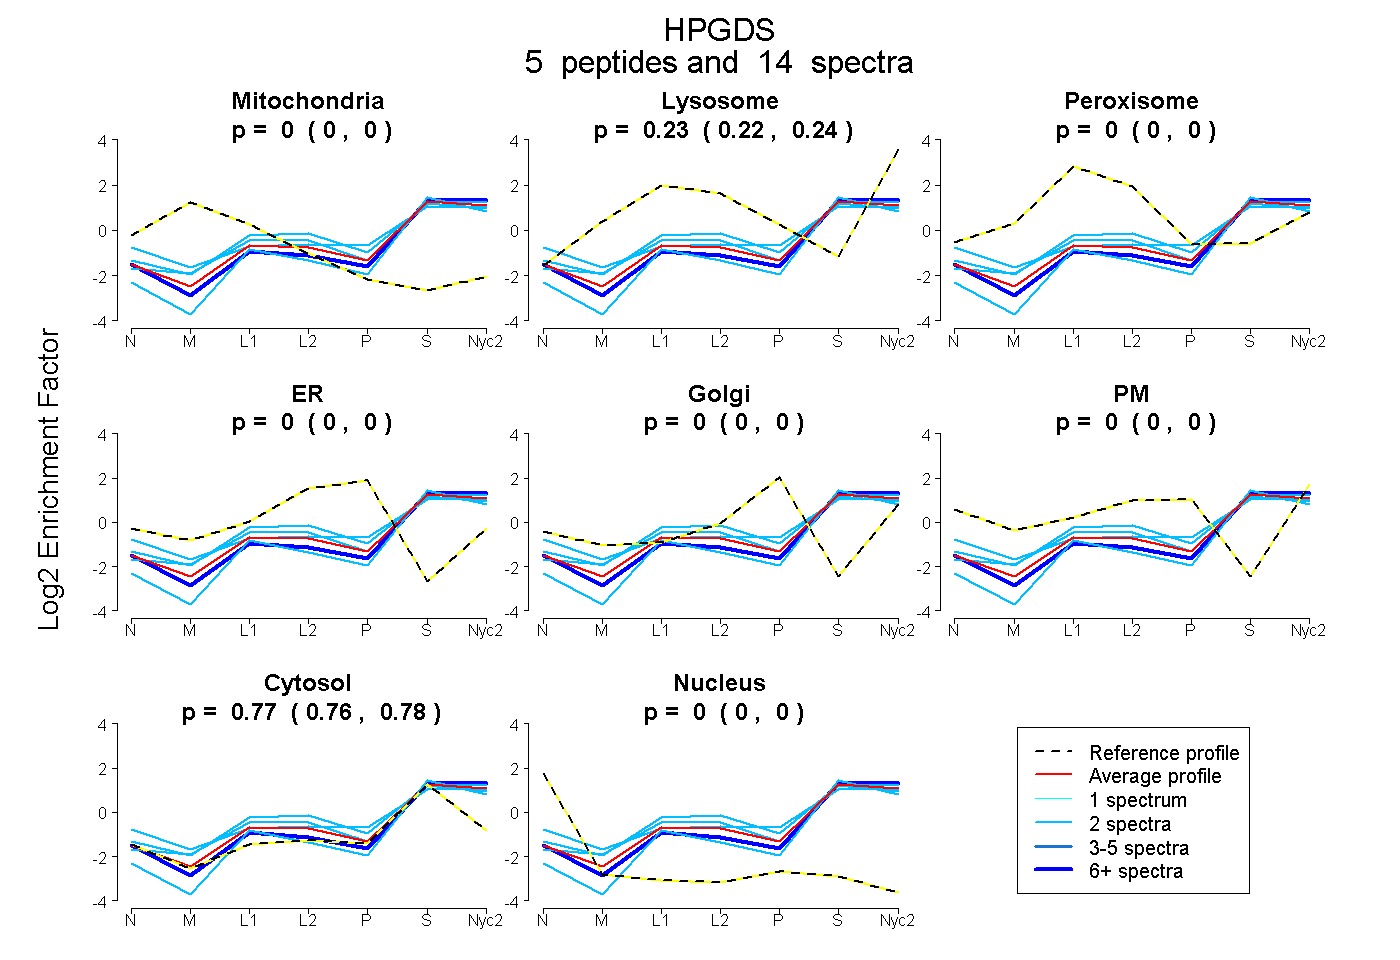 |
0.000
0.000 | 0.000 |
0.228
0.216 | 0.239 |
|
0.000
0.000 | 0.000 |
0.000
0.000 | 0.000 |
0.000
0.000 | 0.000 |
0.000
0.000 | 0.000 |
0.772
0.758 | 0.782 |
0.000
0.000 | 0.000 |
|
| | | Plot |
Mito |
|
Lyso or Perox |
|
ER |
Golgi |
PM |
Cytosol |
Nucleus |
|
| Expt B |
1
peptide |
2
spectra |
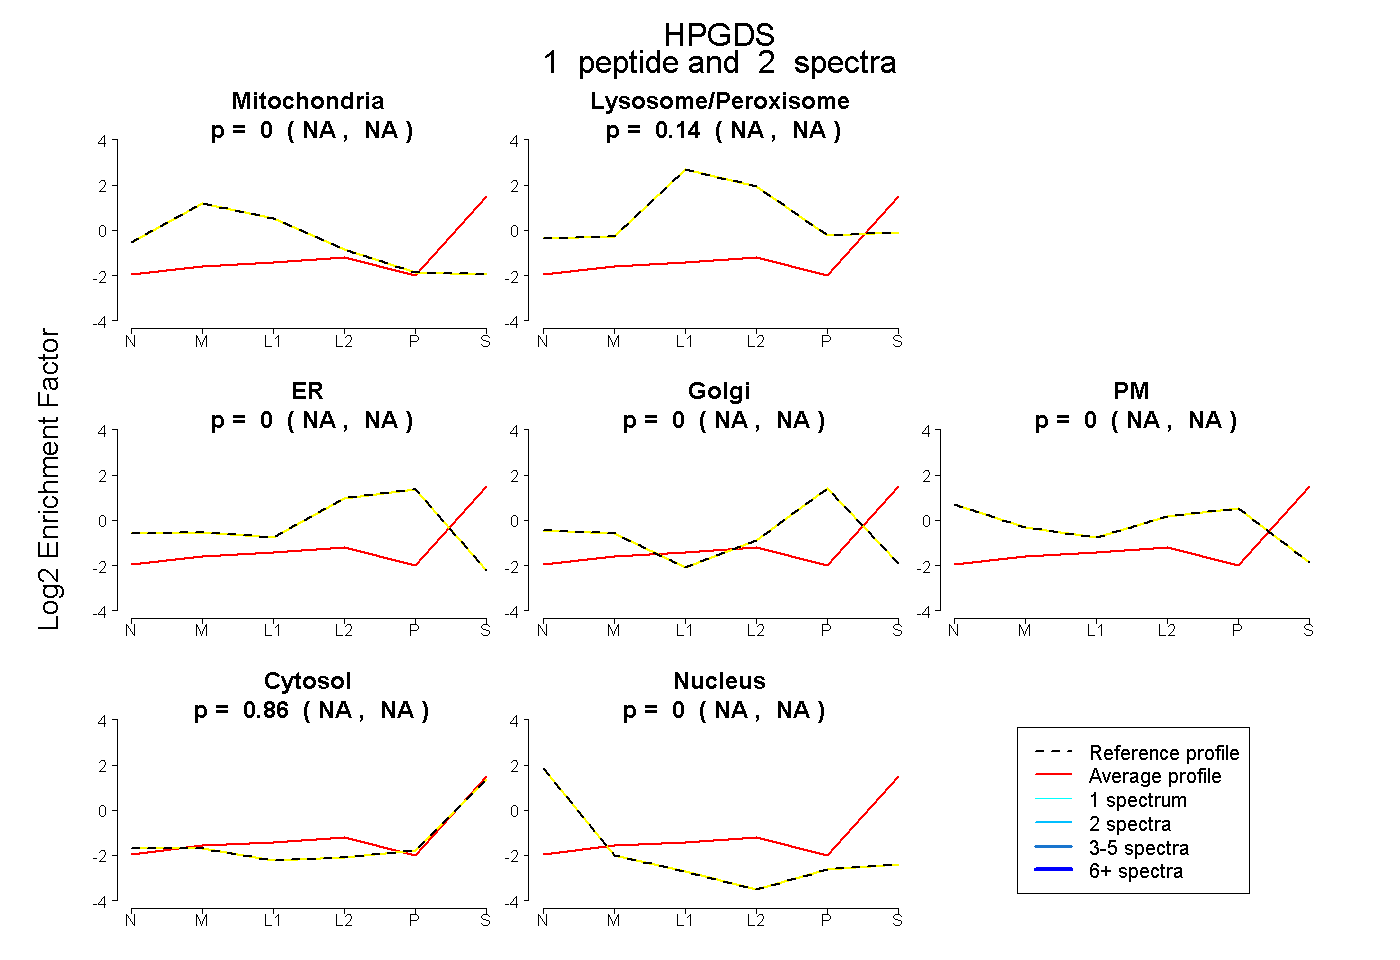 |
0.000
NA | NA |
|
0.138
NA | NA |
|
0.000
NA | NA |
0.000
NA | NA |
0.000
NA | NA |
0.862
NA | NA |
0.000
NA | NA |
|
| | | Plot |
|
Lyso |
|
|
|
|
|
|
|
Other |
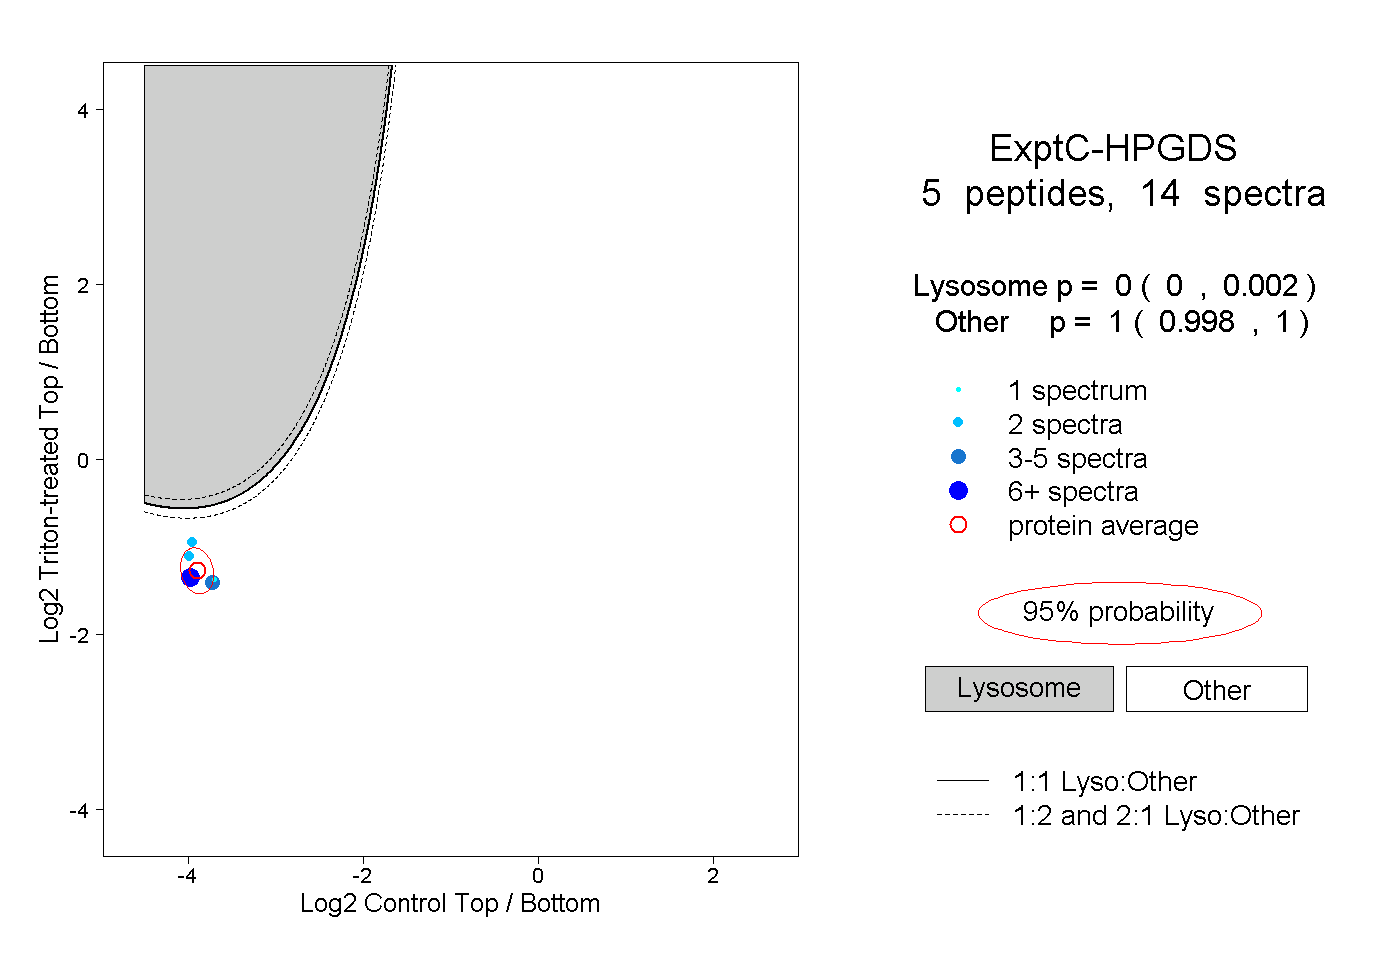
| Expt C |
5
peptides |
14
spectra |
 |
|
0.000
0.000 | 0.002 |
|
|
|
|
|
|
|
1.000
0.998 | 1.000 |
| 2 spectra, TFNDLLTR |
|
0.001 |
|
|
|
|
|
|
|
0.999 |
| 6 spectra, QAPHLLK |
|
0.000 |
|
|
|
|
|
|
|
1.000 |
| 3 spectra, IKPTLPFGK |
|
0.000 |
|
|
|
|
|
|
|
1.000 |
| 2 spectra, NTDLAGK |
|
0.008 |
|
|
|
|
|
|
|
0.992 |
| 1 spectrum, LLYFNMR |
|
0.000 |
|
|
|
|
|
|
|
1.000 |
| | | Plot |
|
Lyso |
|
|
|
|
|
|
|
Other |
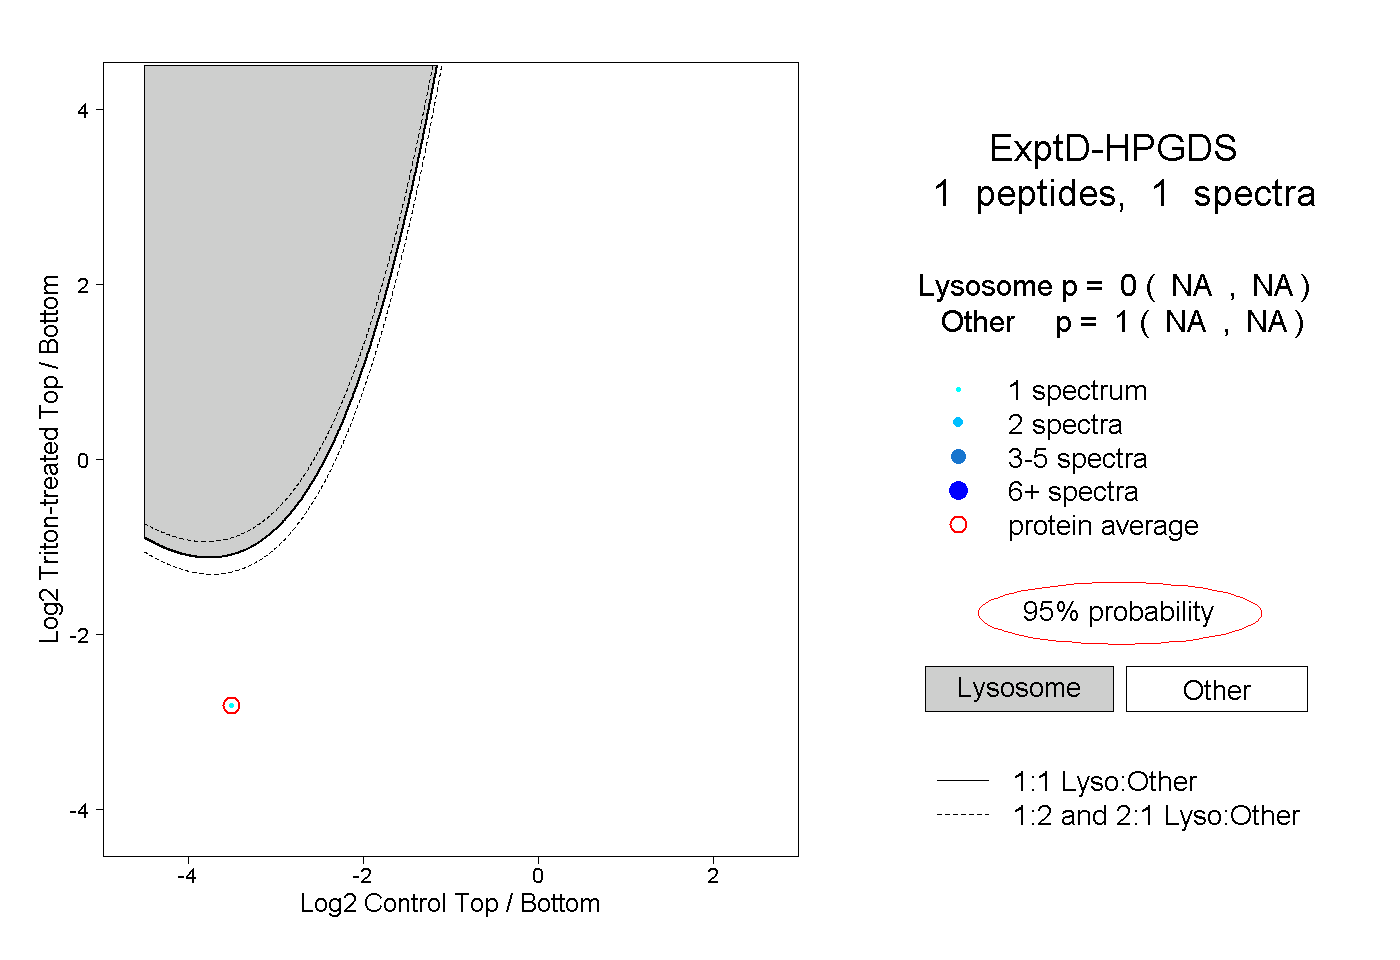
| Expt D |
1
peptide |
1
spectrum |
 |
|
0.000
NA | NA |
|
|
|
|
|
|
|
1.000
NA | NA |