 10
10peptides
spectra
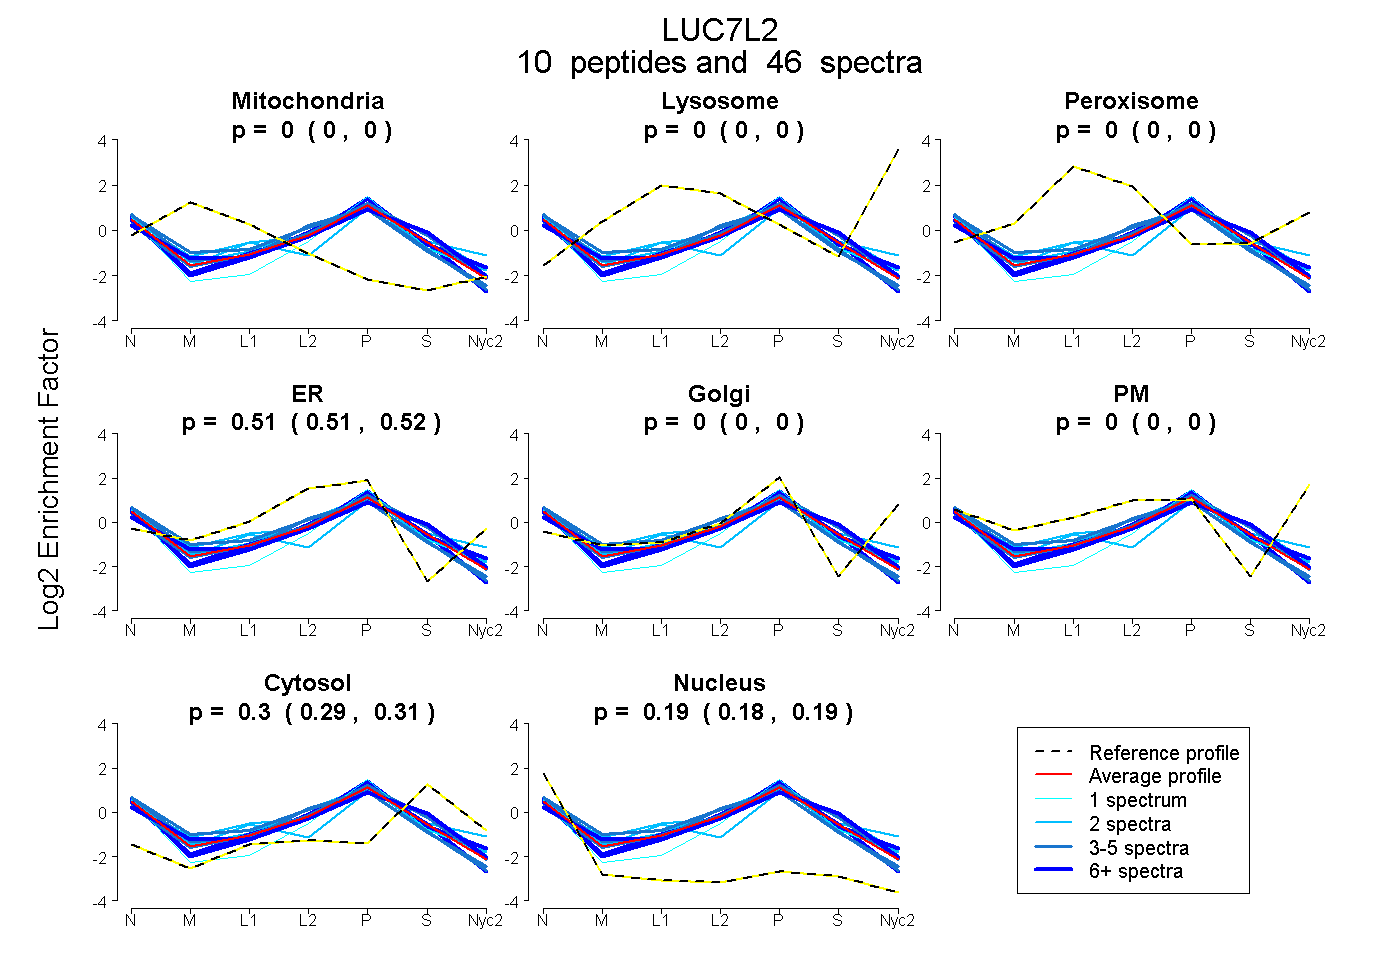
0.000 | 0.000
0.000 | 0.000
0.000 | 0.000
0.507 | 0.516
0.000 | 0.000
0.000 | 0.000
0.293 | 0.305
0.182 | 0.193
3peptides
spectra
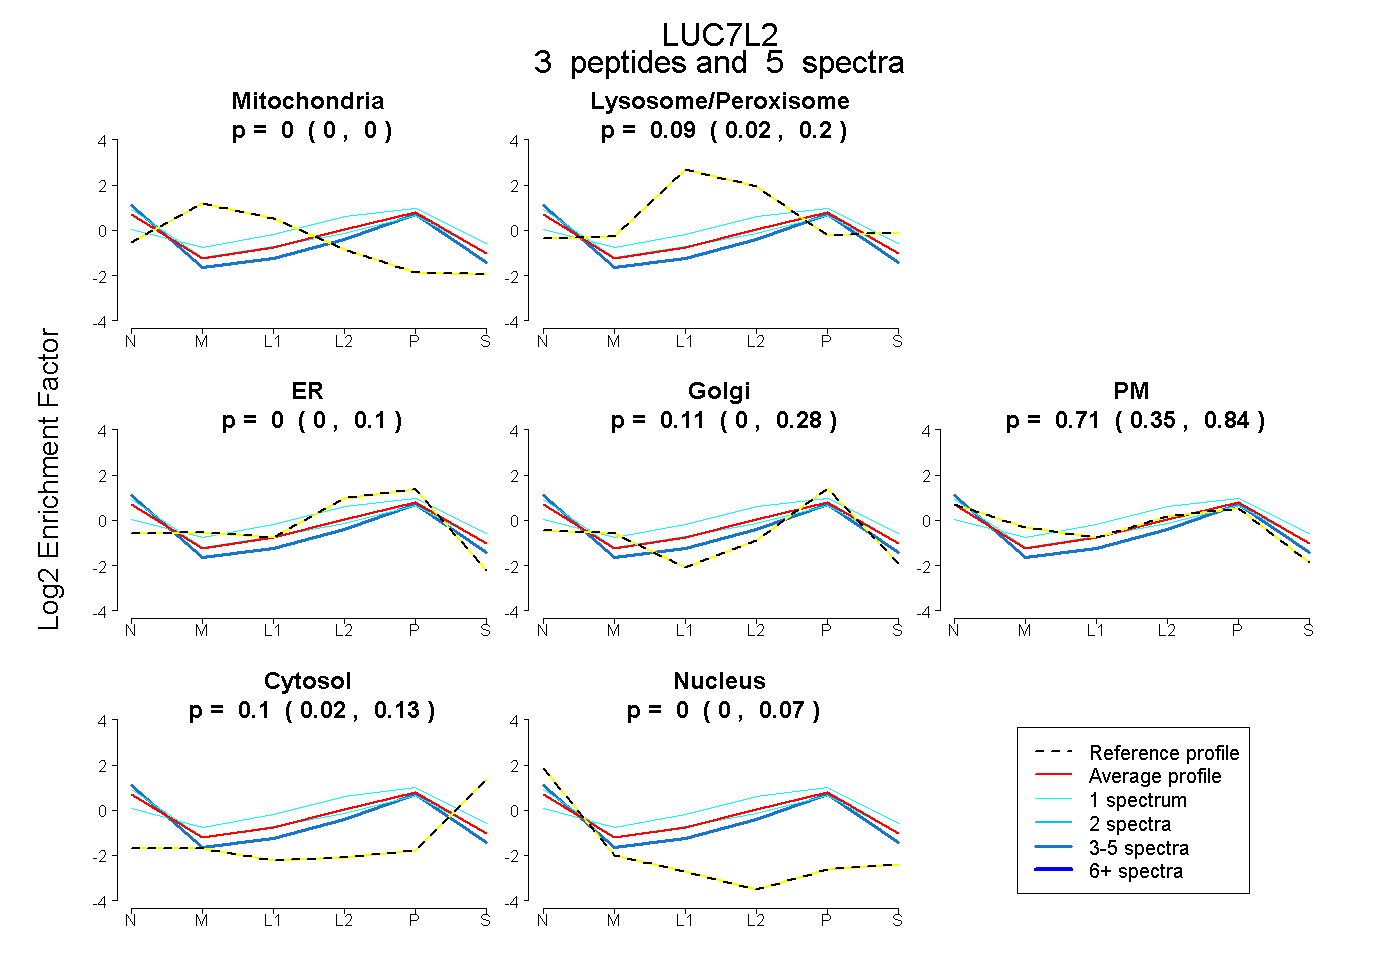
0.000 | 0.000
0.015 | 0.200
0.000 | 0.101
0.000 | 0.282
0.352 | 0.839
0.016 | 0.132
0.000 | 0.070
9peptides
spectra

0.000 | 0.000
1.000 | 1.000
2peptides
spectra
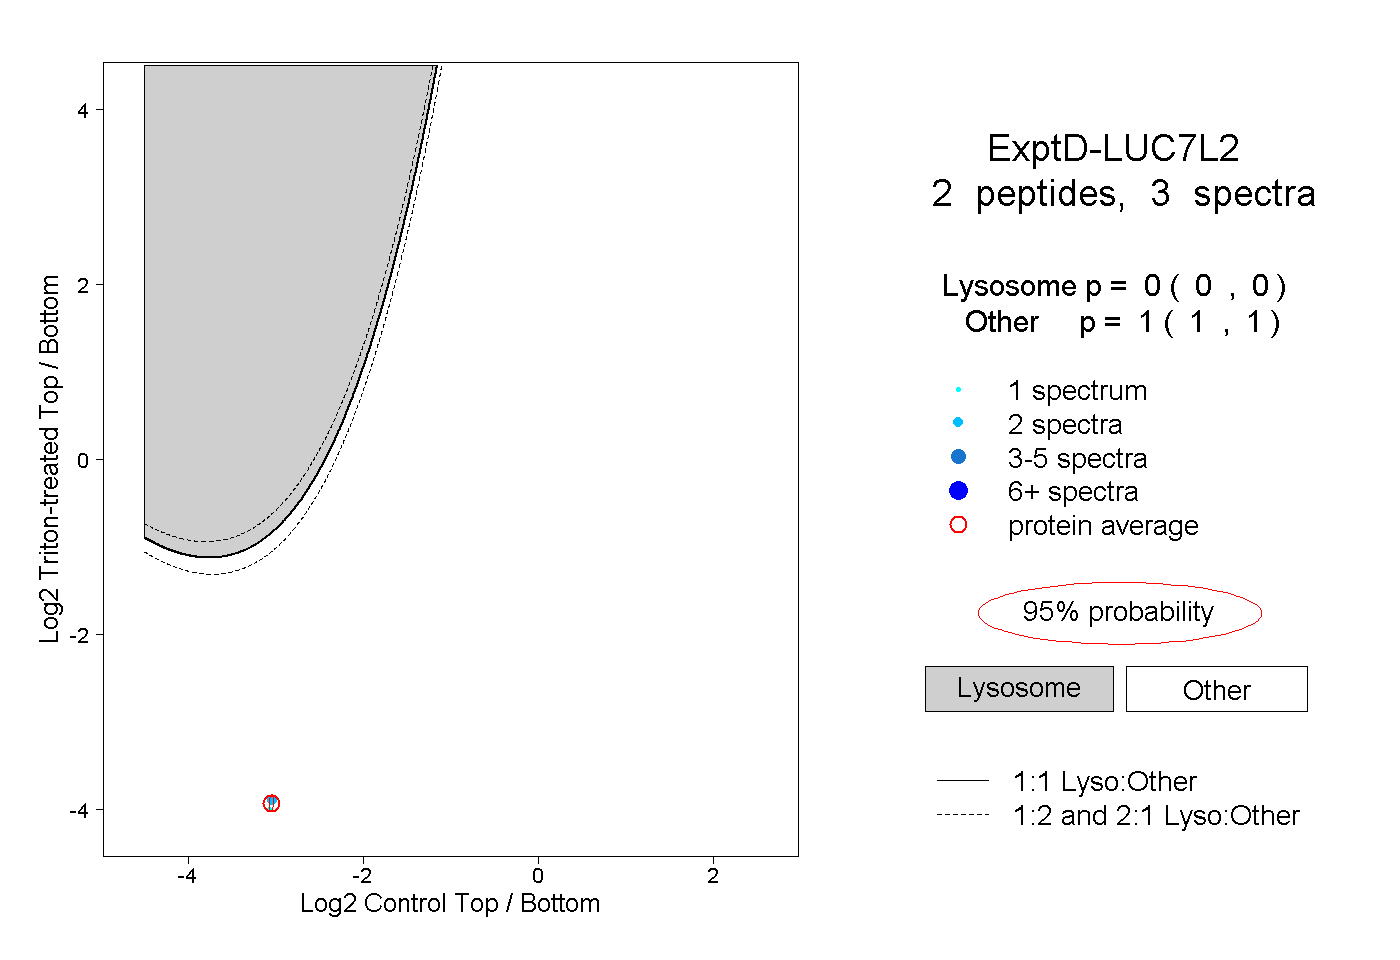
0.000 | 0.000
1.000 | 1.000