 10
10peptides
spectra
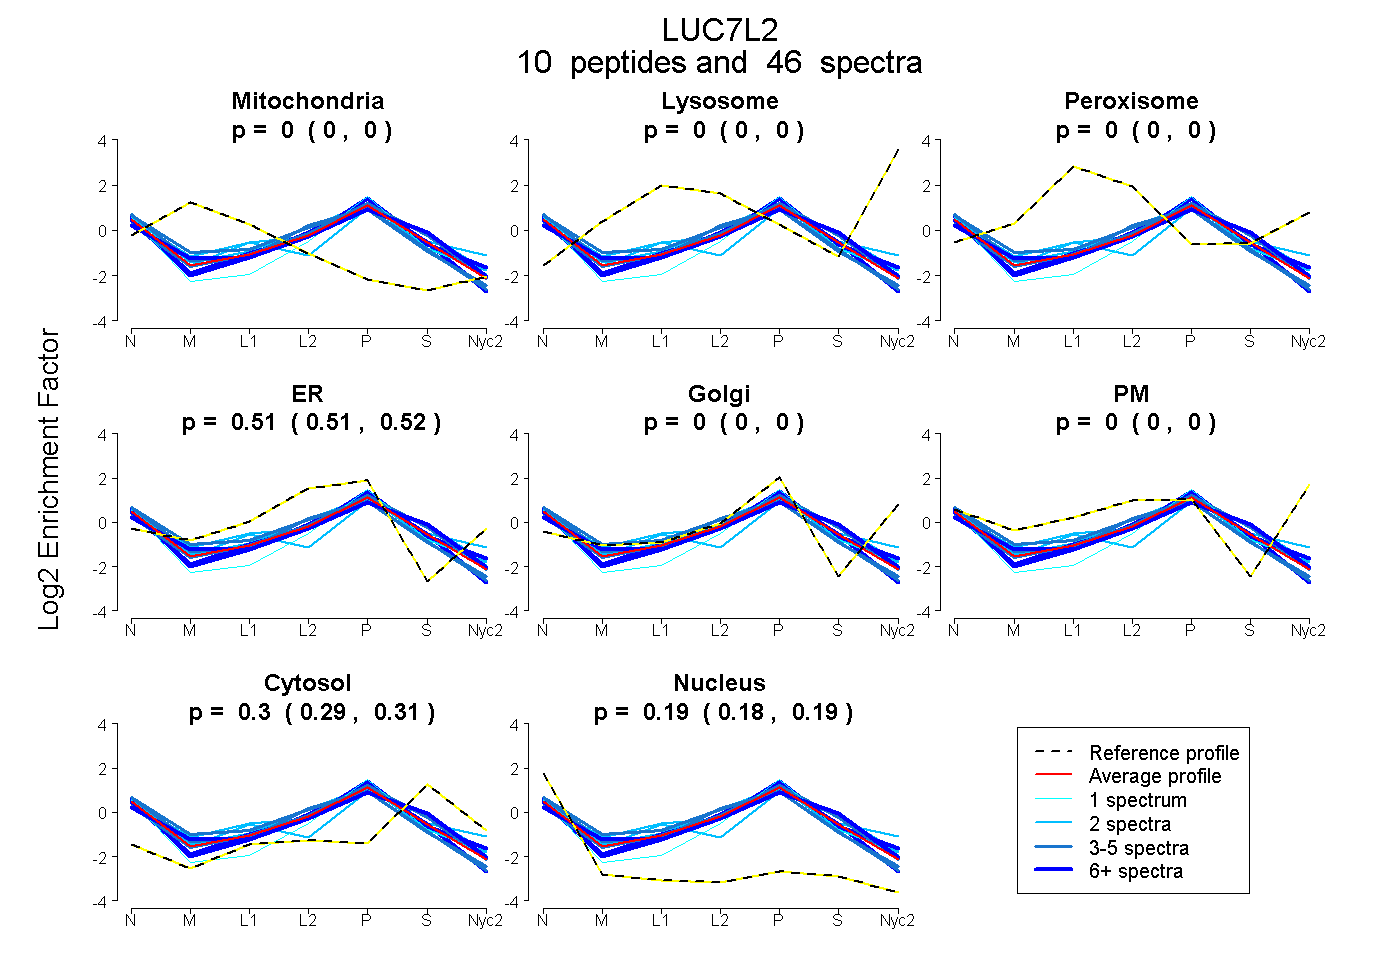
0.000 | 0.000
0.000 | 0.000
0.000 | 0.000
0.507 | 0.516
0.000 | 0.000
0.000 | 0.000
0.293 | 0.305
0.182 | 0.193
| Plot | Mito | Lyso | Perox | ER | Golgi | PM | Cytosol | Nucleus | |||||
| Expt A |
10 peptides |
46 spectra |
|
0.000 0.000 | 0.000 |
0.000 0.000 | 0.000 |
0.000 0.000 | 0.000 |
0.512 0.507 | 0.516 |
0.000 0.000 | 0.000 |
0.000 0.000 | 0.000 |
0.300 0.293 | 0.305 |
0.188 0.182 | 0.193 |
| 10 spectra, EAEEVYR | 0.000 | 0.000 | 0.000 | 0.489 | 0.000 | 0.000 | 0.272 | 0.239 | ||
| 3 spectra, NSMPASSFQQQK | 0.000 | 0.000 | 0.000 | 0.491 | 0.000 | 0.000 | 0.368 | 0.141 | ||
| 2 spectra, AMLDQLMGTSR | 0.000 | 0.000 | 0.000 | 0.401 | 0.030 | 0.000 | 0.406 | 0.162 | ||
| 9 spectra, VMDEVEK | 0.000 | 0.000 | 0.000 | 0.453 | 0.000 | 0.000 | 0.410 | 0.137 | ||
| 2 spectra, LADHFGGK | 0.000 | 0.000 | 0.000 | 0.582 | 0.000 | 0.000 | 0.250 | 0.169 | ||
| 4 spectra, VHDLALR | 0.000 | 0.000 | 0.000 | 0.550 | 0.000 | 0.000 | 0.200 | 0.250 | ||
| 1 spectrum, SAQAQMR | 0.000 | 0.000 | 0.000 | 0.327 | 0.180 | 0.000 | 0.251 | 0.243 | ||
| 4 spectra, VHELNEEIGK | 0.016 | 0.000 | 0.000 | 0.577 | 0.000 | 0.000 | 0.187 | 0.220 | ||
| 9 spectra, MDLGECLK | 0.000 | 0.000 | 0.000 | 0.526 | 0.010 | 0.000 | 0.308 | 0.156 | ||
| 2 spectra, ADYEIASK | 0.000 | 0.000 | 0.034 | 0.475 | 0.072 | 0.000 | 0.319 | 0.100 |
| Plot | Mito | Lyso or Perox | ER | Golgi | PM | Cytosol | Nucleus | ||||||
| Expt B |
3 peptides |
5 spectra |
 |
0.000 0.000 | 0.000 |
0.088 0.015 | 0.200 |
0.000 0.000 | 0.101 |
0.106 0.000 | 0.282 |
0.705 0.352 | 0.839 |
0.101 0.016 | 0.132 |
0.000 0.000 | 0.070 |
|||
| Plot | Lyso | Other | |||||||||||
| Expt C |
9 peptides |
28 spectra |
 |
0.000 0.000 | 0.000 |
1.000 1.000 | 1.000 |
||||||||
| Plot | Lyso | Other | |||||||||||
| Expt D |
2 peptides |
3 spectra |
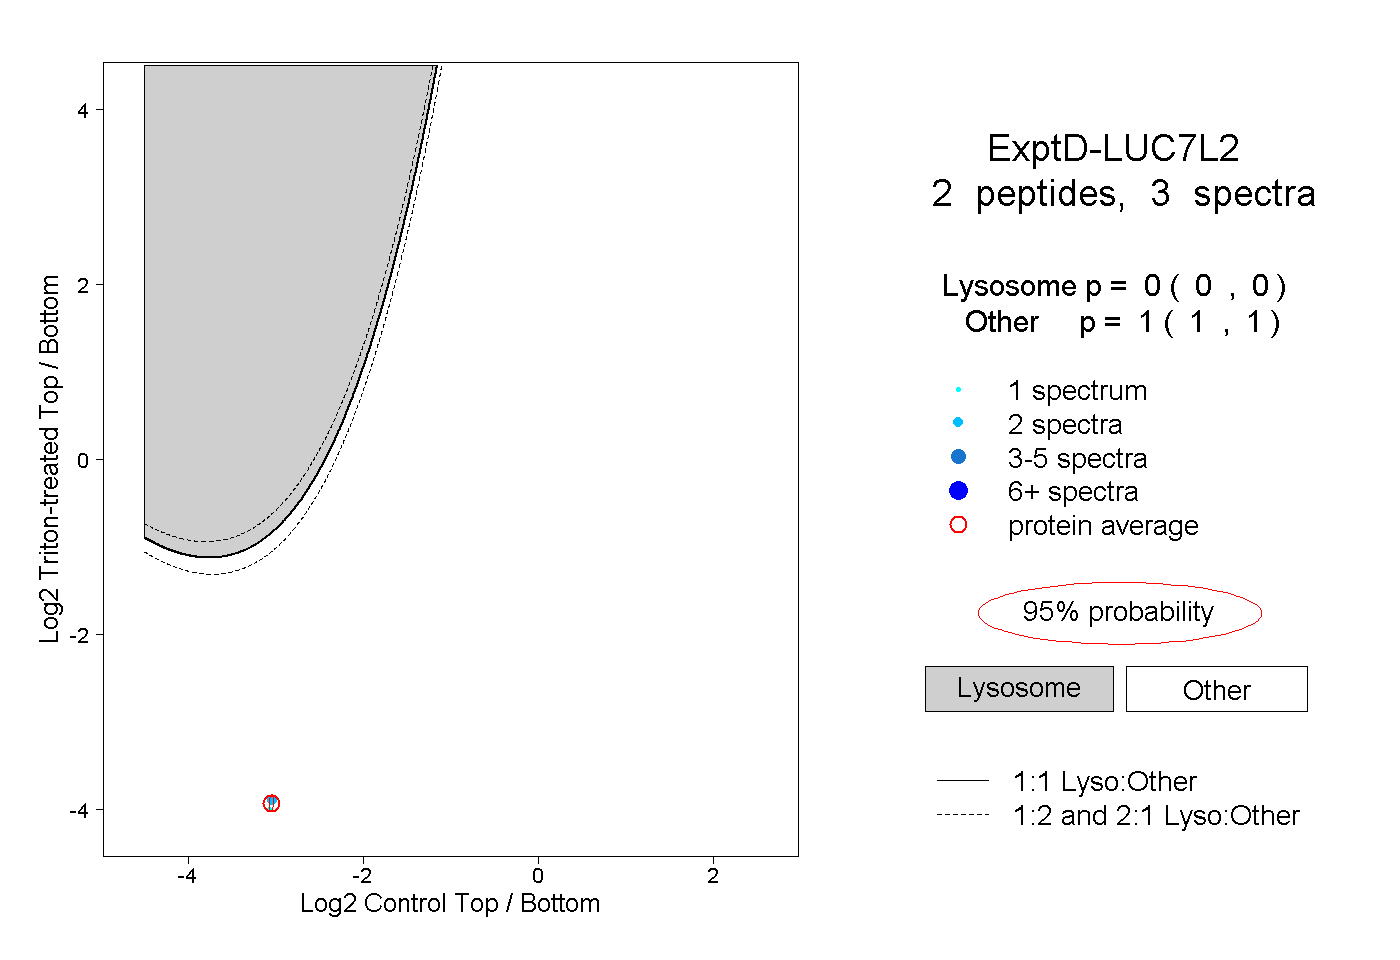 |
0.000 0.000 | 0.000 |
1.000 1.000 | 1.000 |