 10
10peptides
spectra
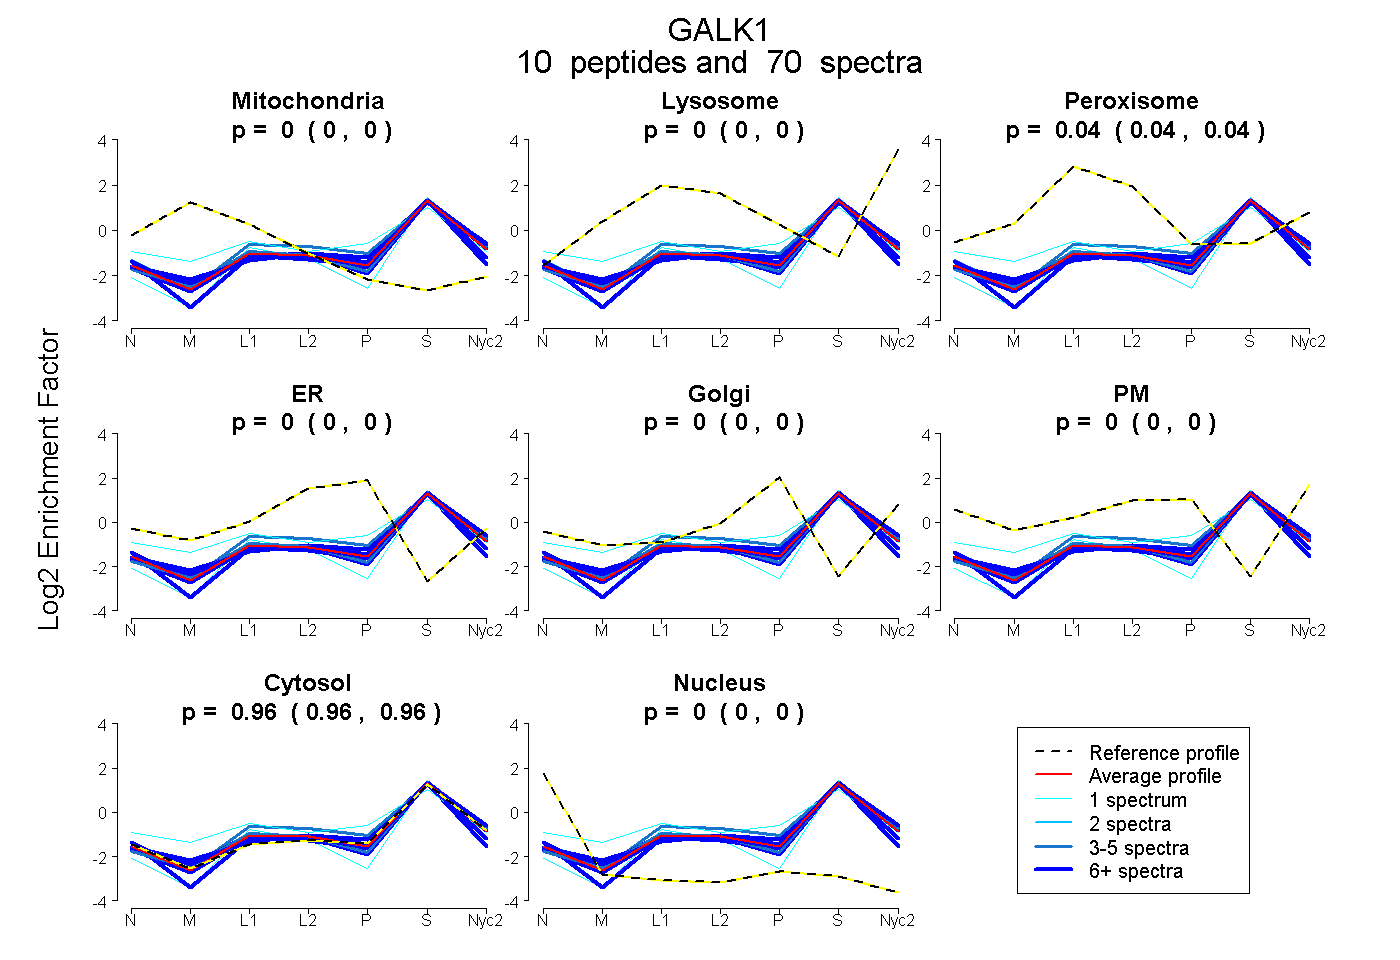
0.000 | 0.000
0.000 | 0.000
0.036 | 0.042
0.000 | 0.000
0.000 | 0.000
0.000 | 0.000
0.958 | 0.963
0.000 | 0.000
8peptides
spectra
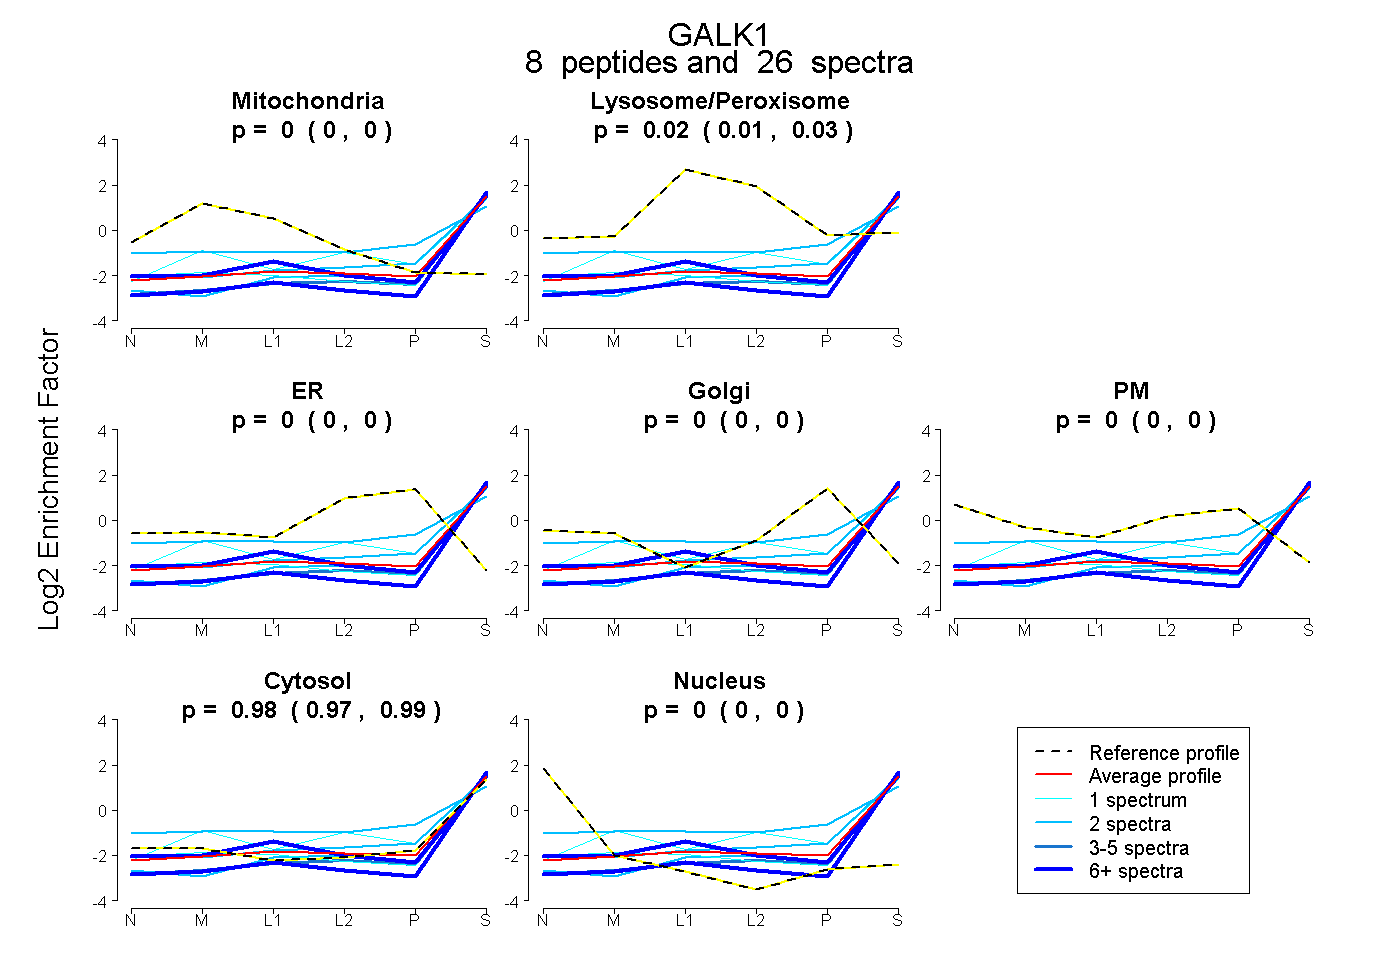
0.000 | 0.000
0.007 | 0.027
0.000 | 0.000
0.000 | 0.000
0.000 | 0.000
0.971 | 0.991
0.000 | 0.000
11peptides
spectra
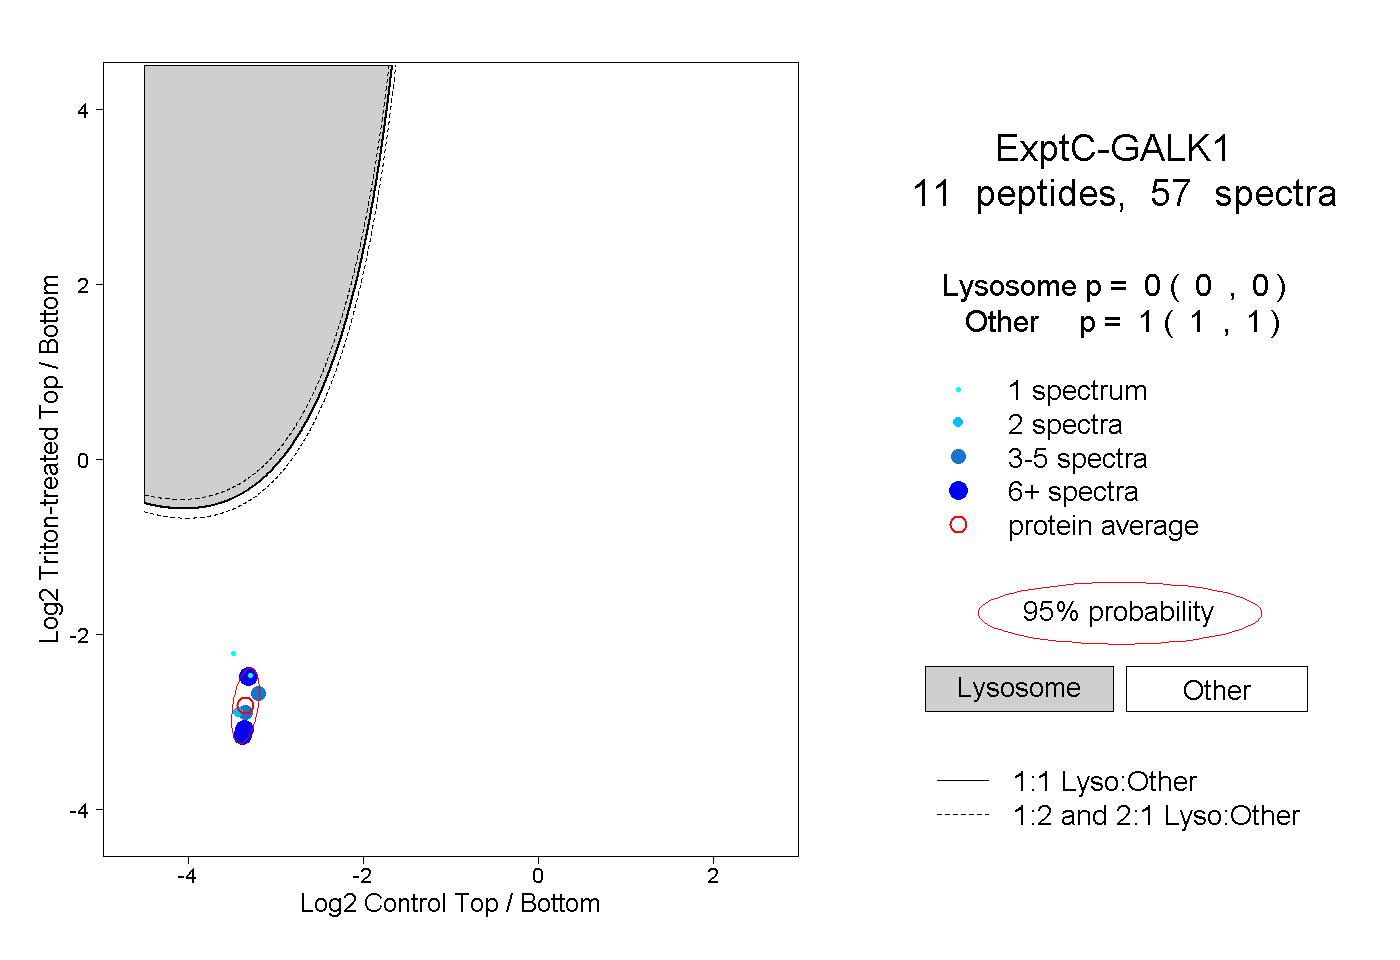
0.000 | 0.000
1.000 | 1.000
3peptides
spectra
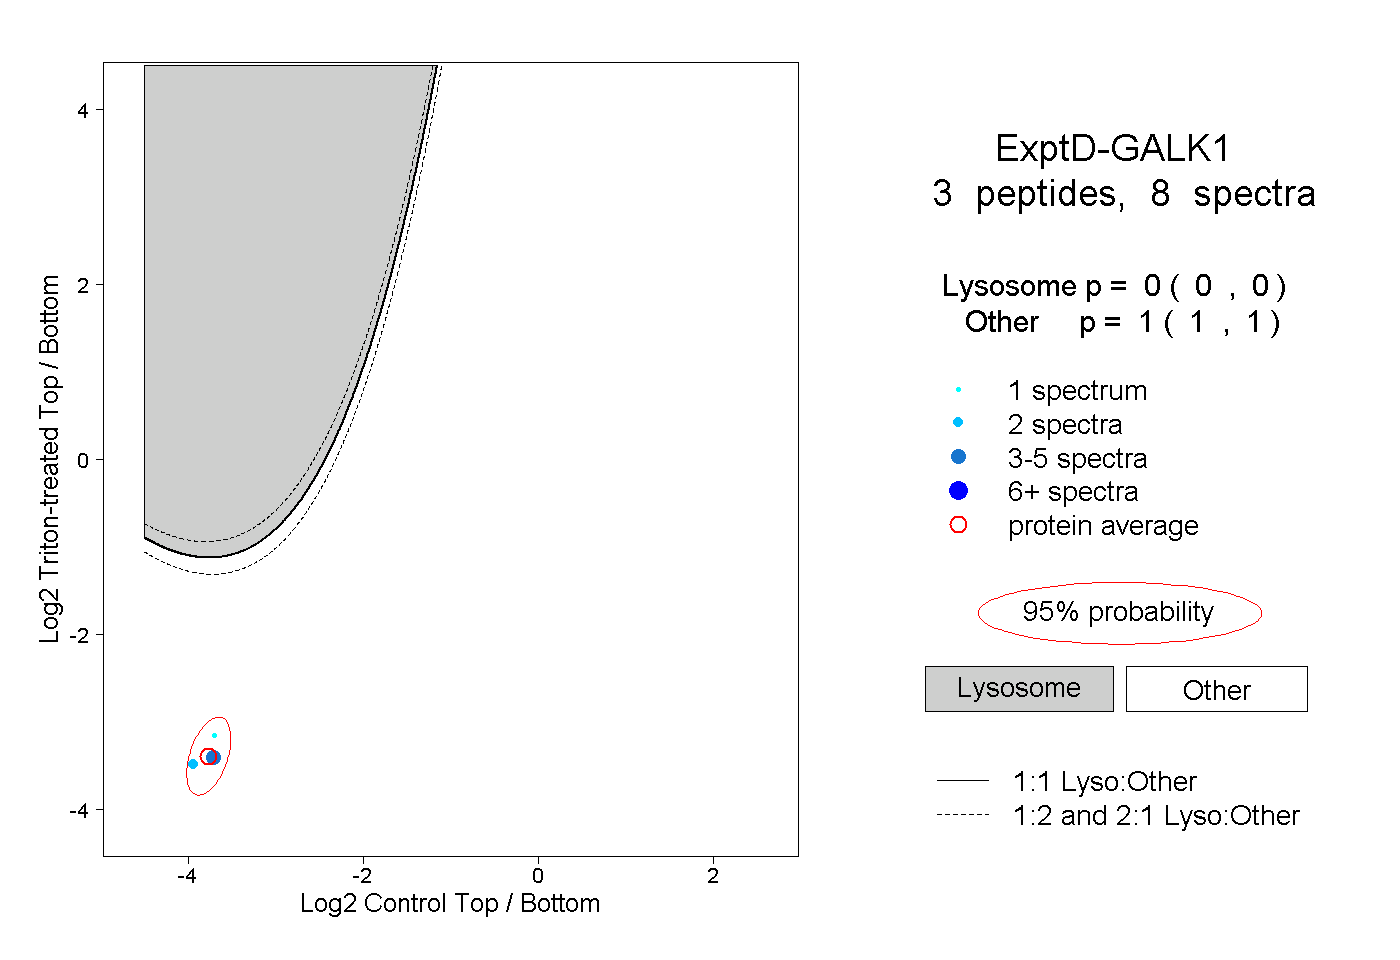
0.000 | 0.000
1.000 | 1.000