 10
10peptides
spectra
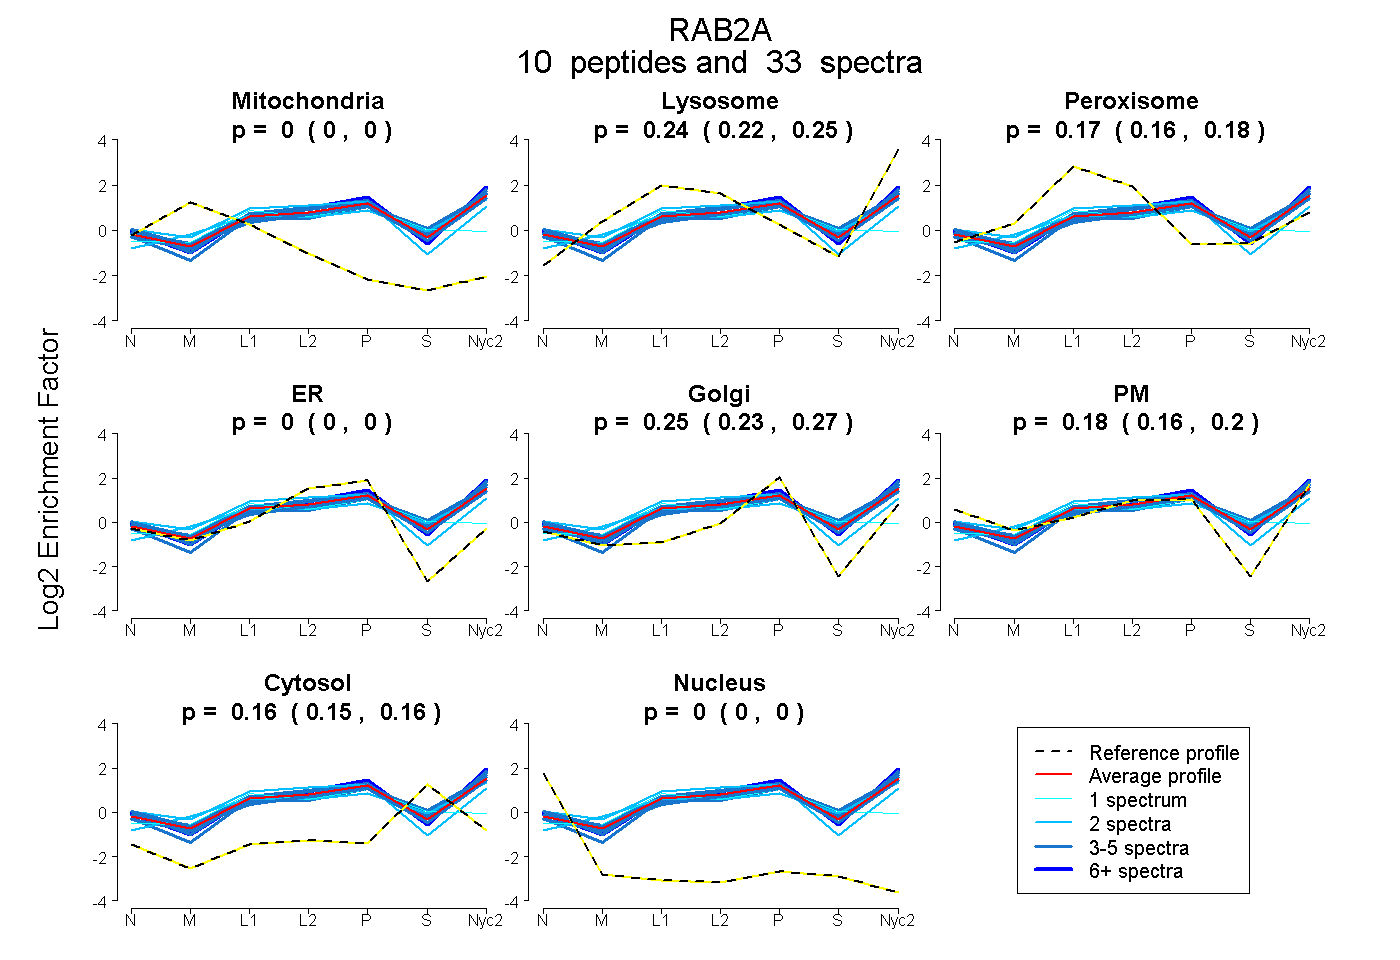
0.000 | 0.000
0.223 | 0.248
0.157 | 0.184
0.000 | 0.000
0.235 | 0.268
0.160 | 0.198
0.152 | 0.163
0.000 | 0.000
7peptides
spectra
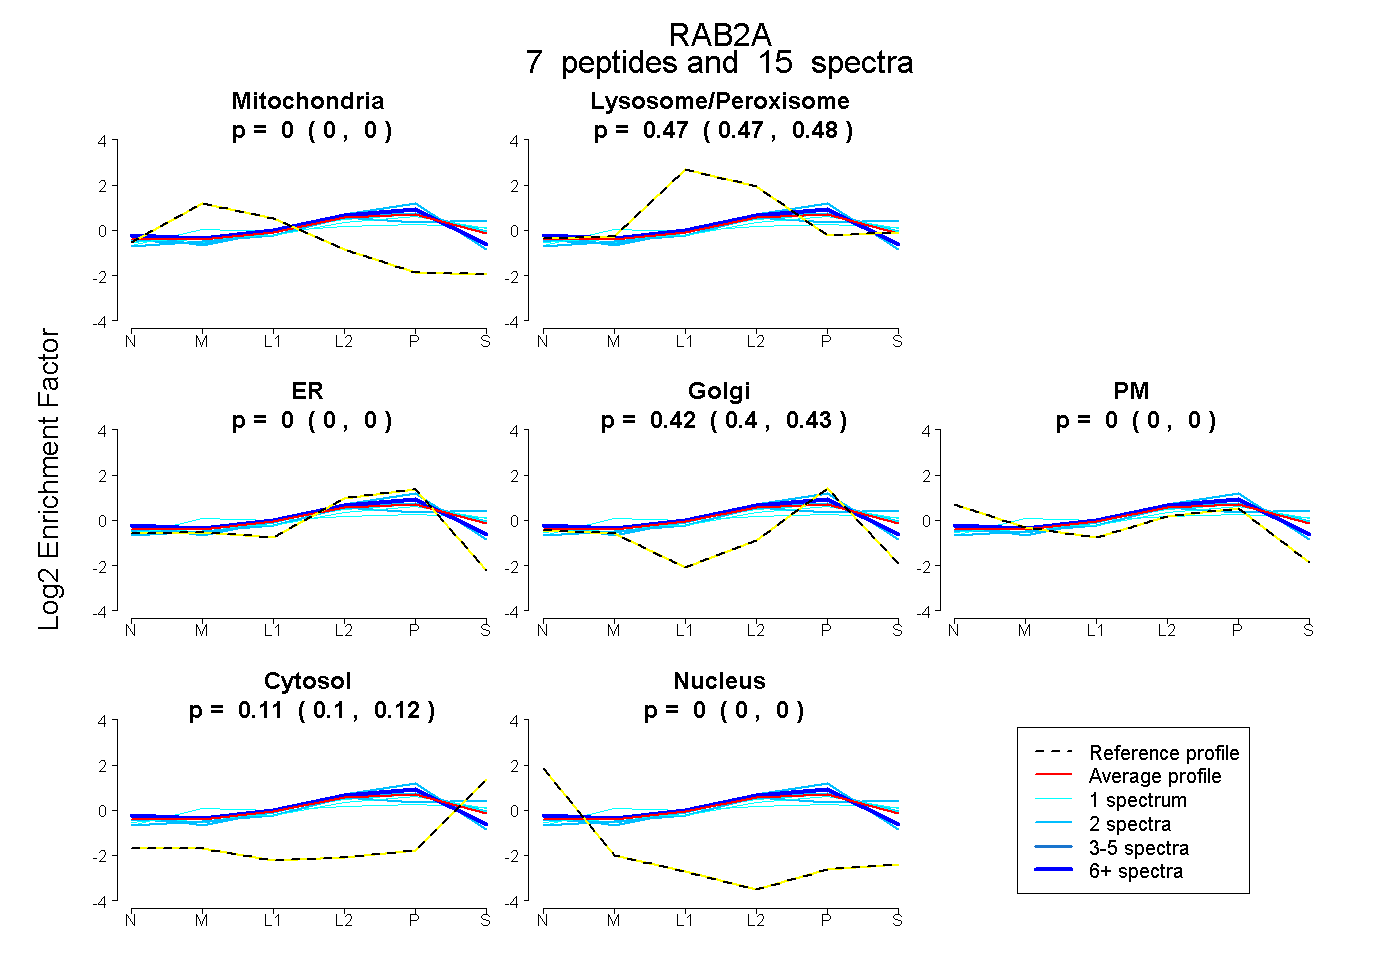
0.000 | 0.000
0.466 | 0.475
0.000 | 0.000
0.404 | 0.433
0.000 | 0.000
0.096 | 0.121
0.000 | 0.000
9peptides
spectra
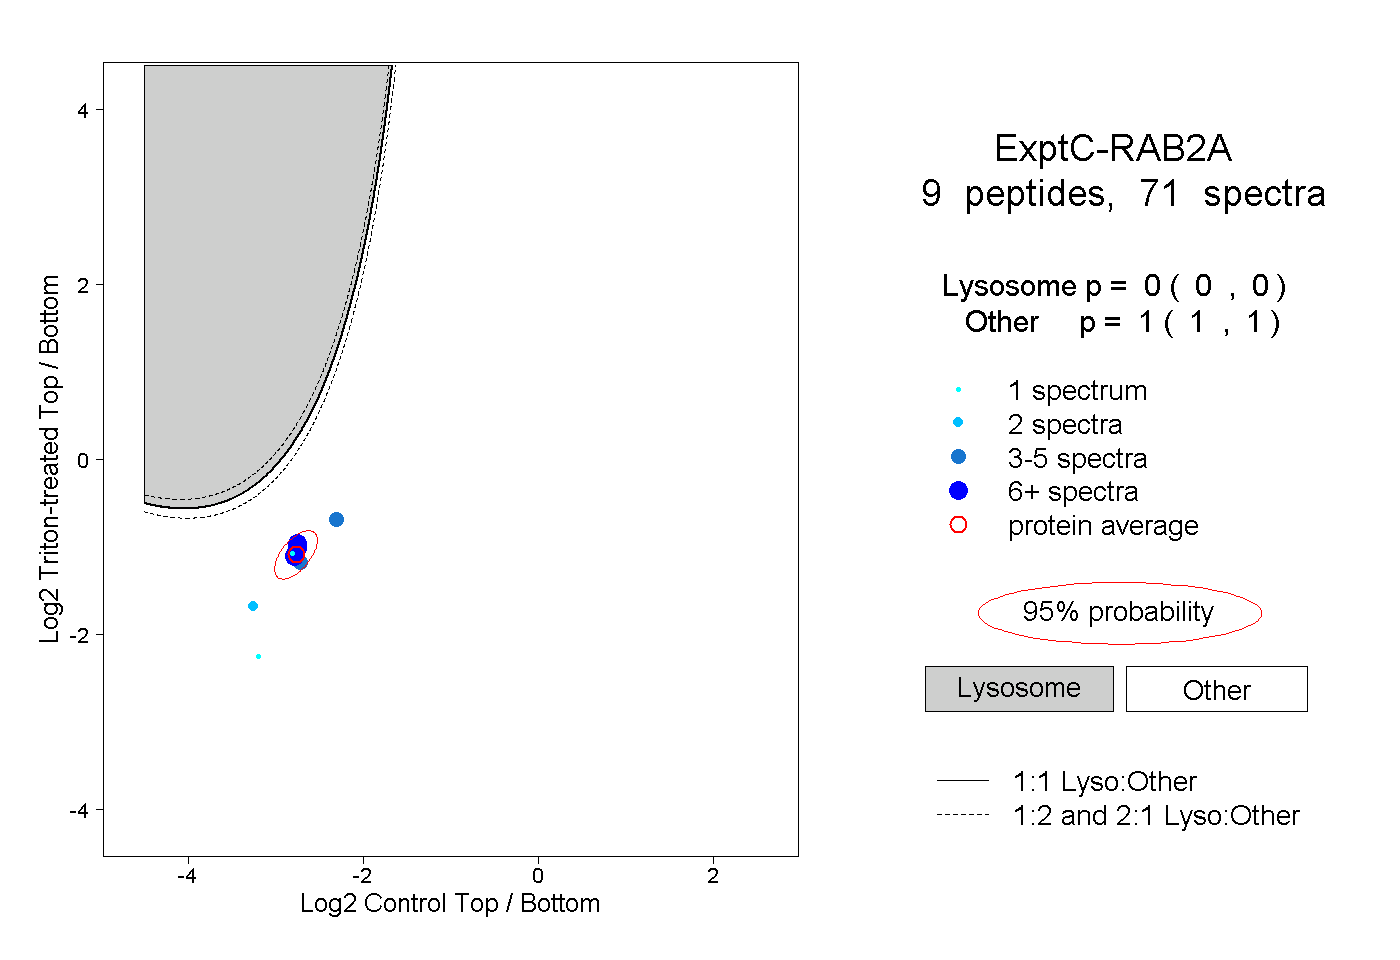
0.000 | 0.000
1.000 | 1.000
2peptides
spectra
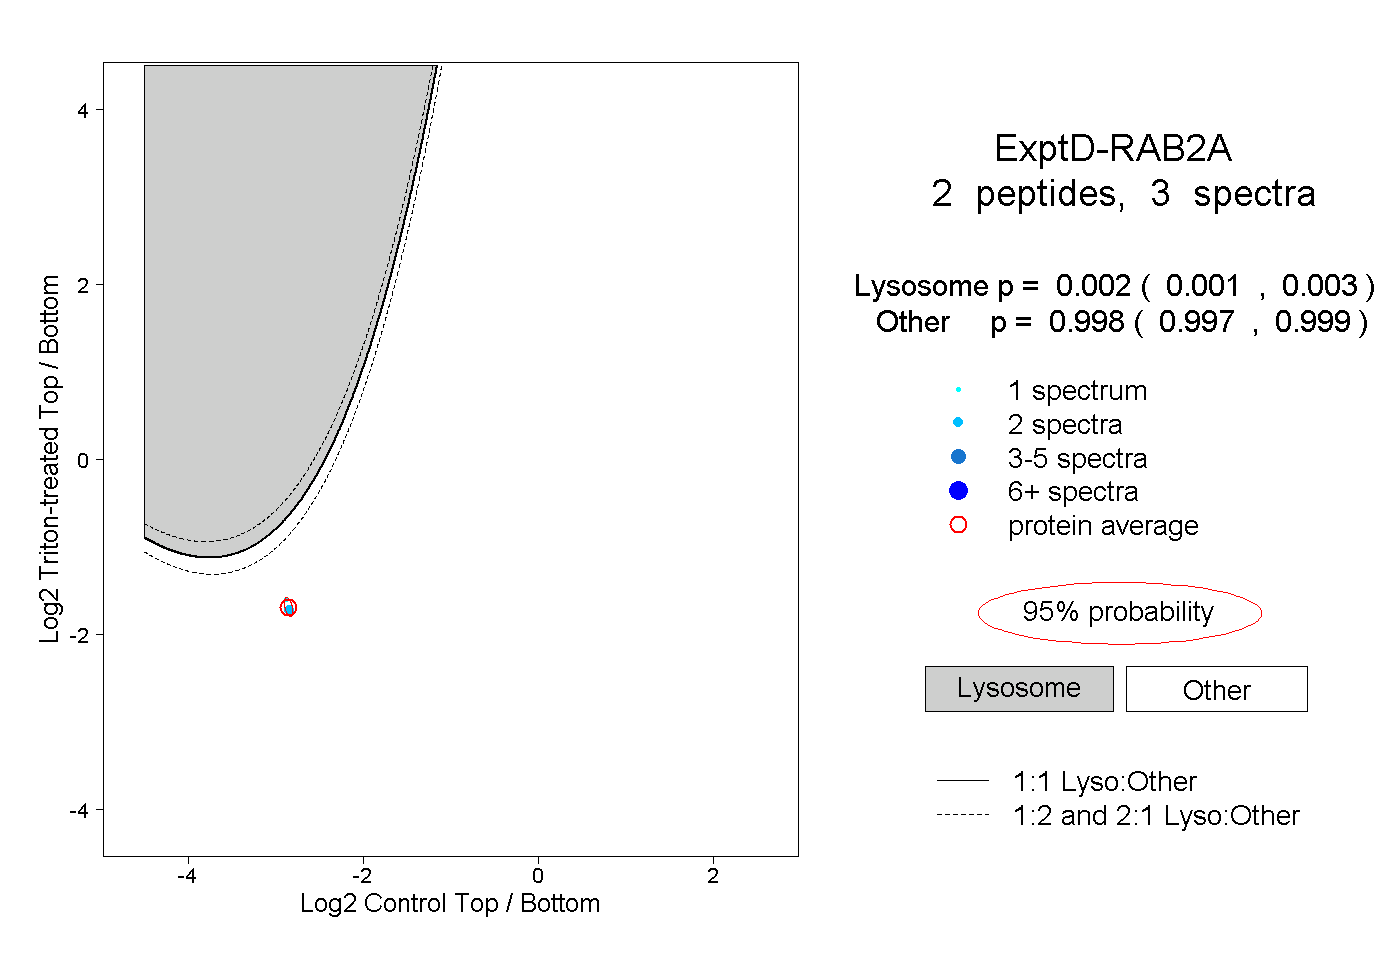
0.001 | 0.003
0.997 | 0.999