 10
10peptides
spectra
0.000 | 0.000
0.223 | 0.248
0.157 | 0.184
0.000 | 0.000
0.235 | 0.268
0.160 | 0.198
0.152 | 0.163
0.000 | 0.000
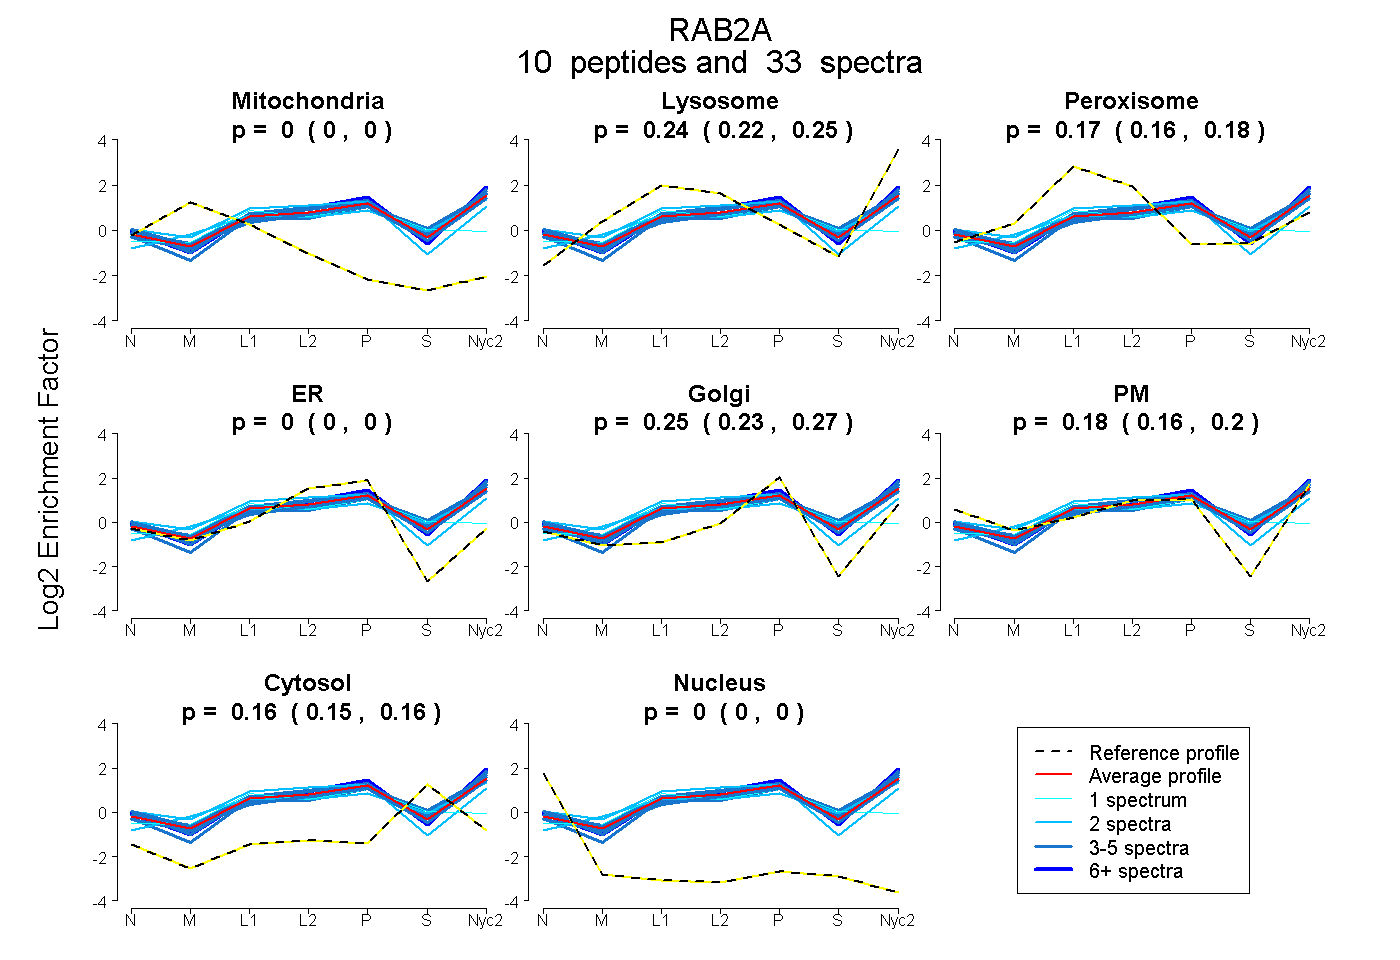
| Plot | Mito | Lyso | Perox | ER | Golgi | PM | Cytosol | Nucleus | |||||
| Expt A |
10 peptides |
33 spectra |
|
0.000 0.000 | 0.000 |
0.236 0.223 | 0.248 |
0.172 0.157 | 0.184 |
0.000 0.000 | 0.000 |
0.253 0.235 | 0.268 |
0.181 0.160 | 0.198 |
0.158 0.152 | 0.163 |
0.000 0.000 | 0.000 |
| 4 spectra, EHGLIFMETSAK | 0.000 | 0.299 | 0.093 | 0.000 | 0.204 | 0.267 | 0.137 | 0.000 | ||
| 2 spectra, QHSNSNMVIMLIGNK | 0.000 | 0.333 | 0.199 | 0.000 | 0.257 | 0.000 | 0.210 | 0.000 | ||
| 5 spectra, MITIDGK | 0.000 | 0.324 | 0.086 | 0.000 | 0.243 | 0.137 | 0.210 | 0.000 | ||
| 3 spectra, TASNVEEAFINTAK | 0.000 | 0.164 | 0.118 | 0.000 | 0.143 | 0.383 | 0.191 | 0.000 | ||
| 3 spectra, FQPVHDLTIGVEFGAR | 0.000 | 0.258 | 0.091 | 0.000 | 0.122 | 0.380 | 0.148 | 0.000 | ||
| 1 spectrum, SCLLLQFTDK | 0.000 | 0.000 | 0.410 | 0.174 | 0.177 | 0.000 | 0.240 | 0.000 | ||
| 4 spectra, LQIWDTAGQESFR | 0.000 | 0.294 | 0.117 | 0.000 | 0.128 | 0.277 | 0.184 | 0.000 | ||
| 3 spectra, GAAGALLVYDITR | 0.000 | 0.303 | 0.067 | 0.000 | 0.158 | 0.189 | 0.284 | 0.000 | ||
| 2 spectra, IQEGVFDINNEANGIK | 0.000 | 0.004 | 0.427 | 0.000 | 0.376 | 0.194 | 0.000 | 0.000 | ||
| 6 spectra, EEGEAFAR | 0.000 | 0.294 | 0.060 | 0.000 | 0.193 | 0.326 | 0.127 | 0.000 |
| Plot | Mito | Lyso or Perox | ER | Golgi | PM | Cytosol | Nucleus | ||||||
| Expt B |
7 peptides |
15 spectra |
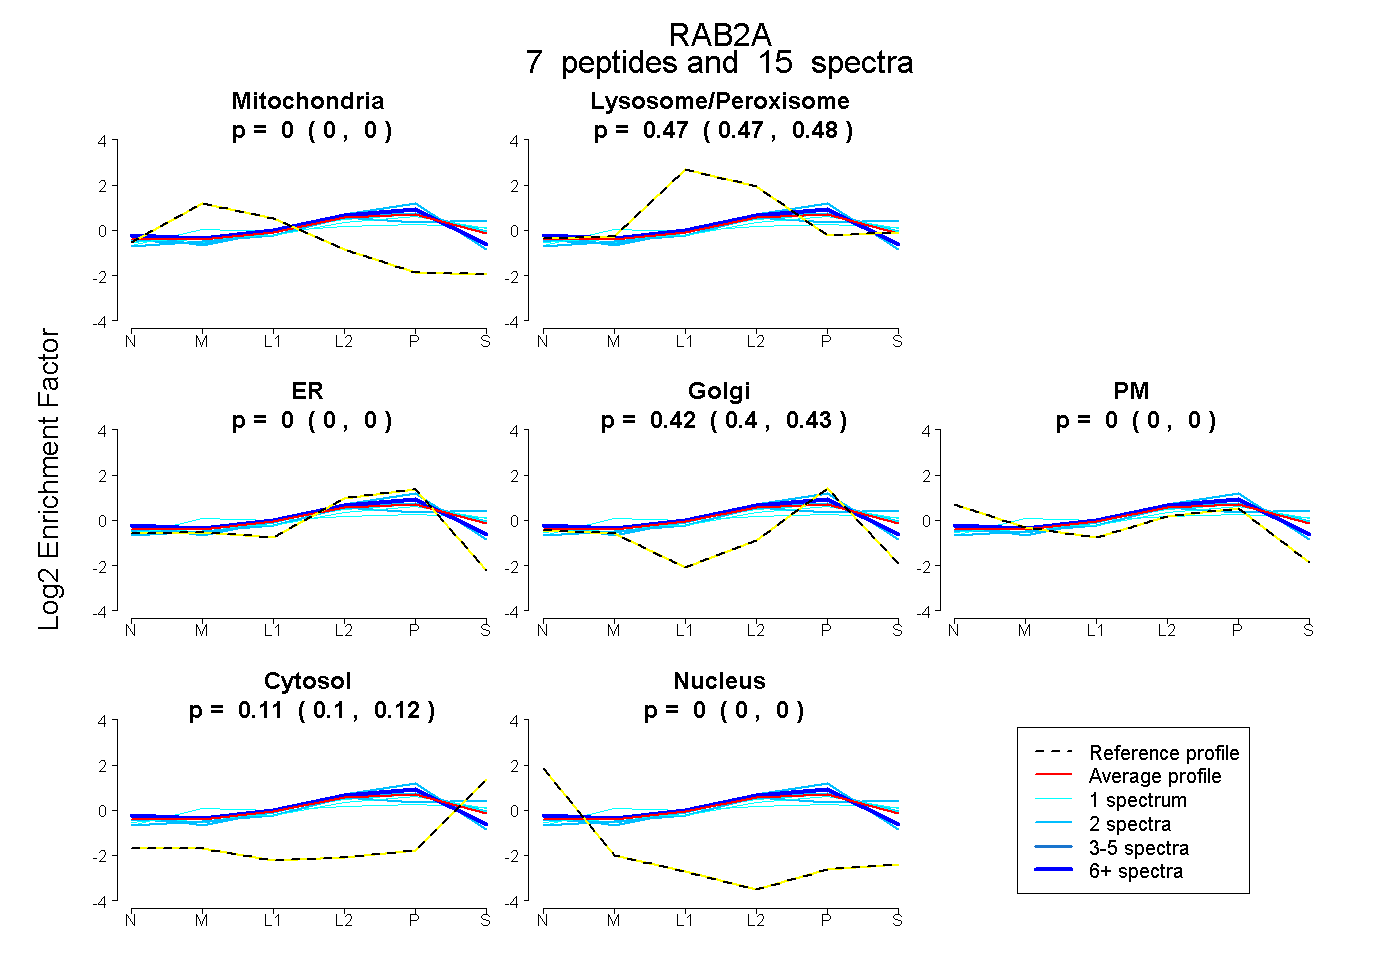 |
0.000 0.000 | 0.000 |
0.471 0.466 | 0.475 |
0.000 0.000 | 0.000 |
0.419 0.404 | 0.433 |
0.000 0.000 | 0.000 |
0.110 0.096 | 0.121 |
0.000 0.000 | 0.000 |
|||
| Plot | Lyso | Other | |||||||||||
| Expt C |
9 peptides |
71 spectra |
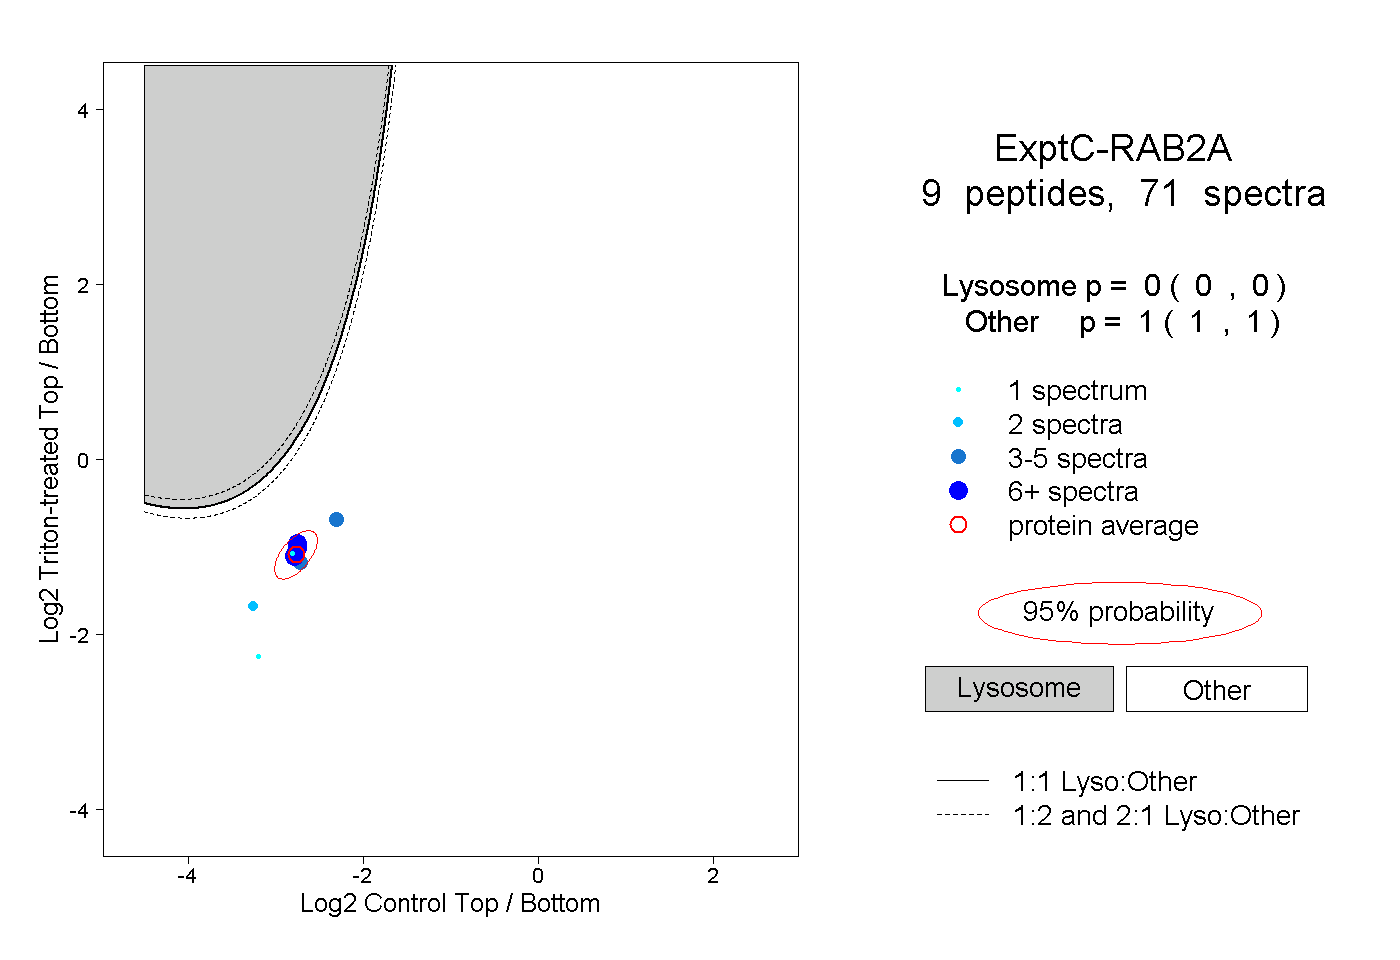 |
0.000 0.000 | 0.000 |
1.000 1.000 | 1.000 |
||||||||
| Plot | Lyso | Other | |||||||||||
| Expt D |
2 peptides |
3 spectra |
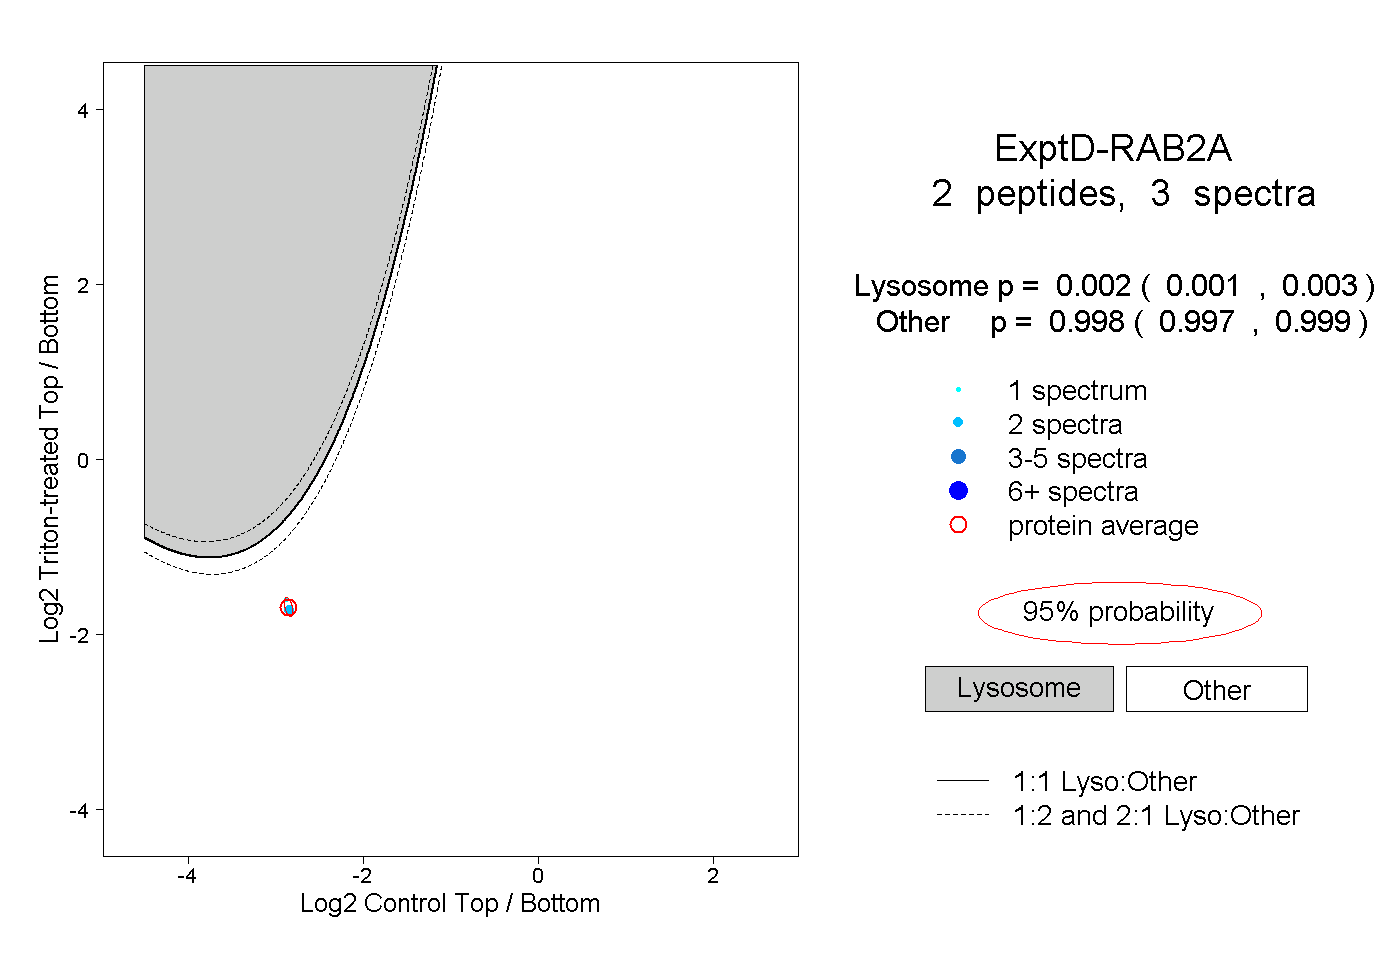 |
0.002 0.001 | 0.003 |
0.998 0.997 | 0.999 |