 4
4peptides
spectra
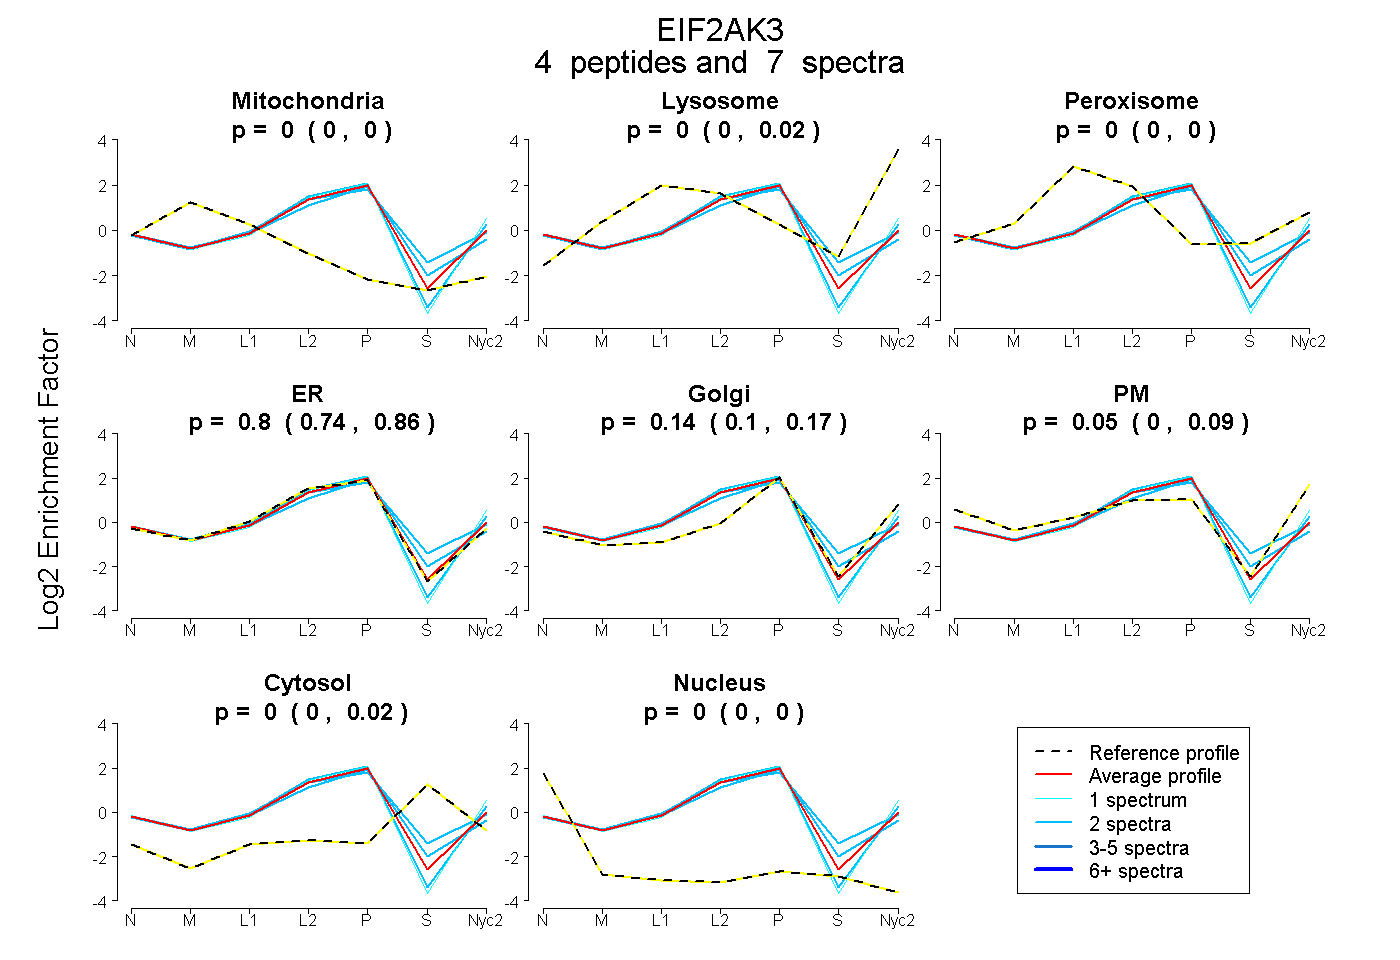
0.000 | 0.000
0.000 | 0.018
0.000 | 0.002
0.743 | 0.857
0.101 | 0.169
0.003 | 0.087
0.000 | 0.025
0.000 | 0.002
1peptide
spectrum
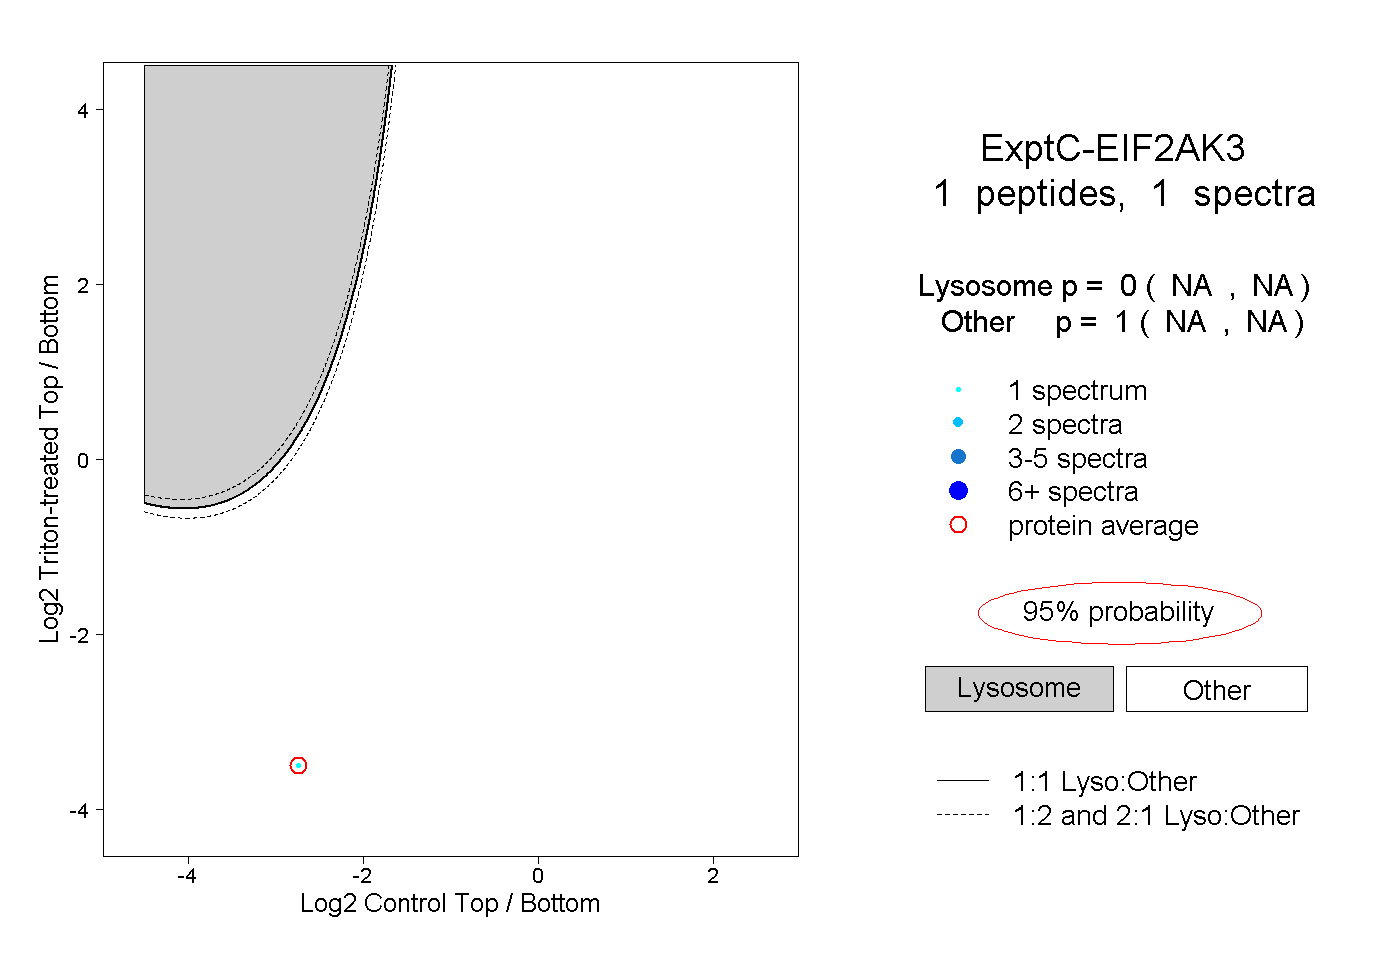
NA | NA
NA | NA
1peptide
spectrum
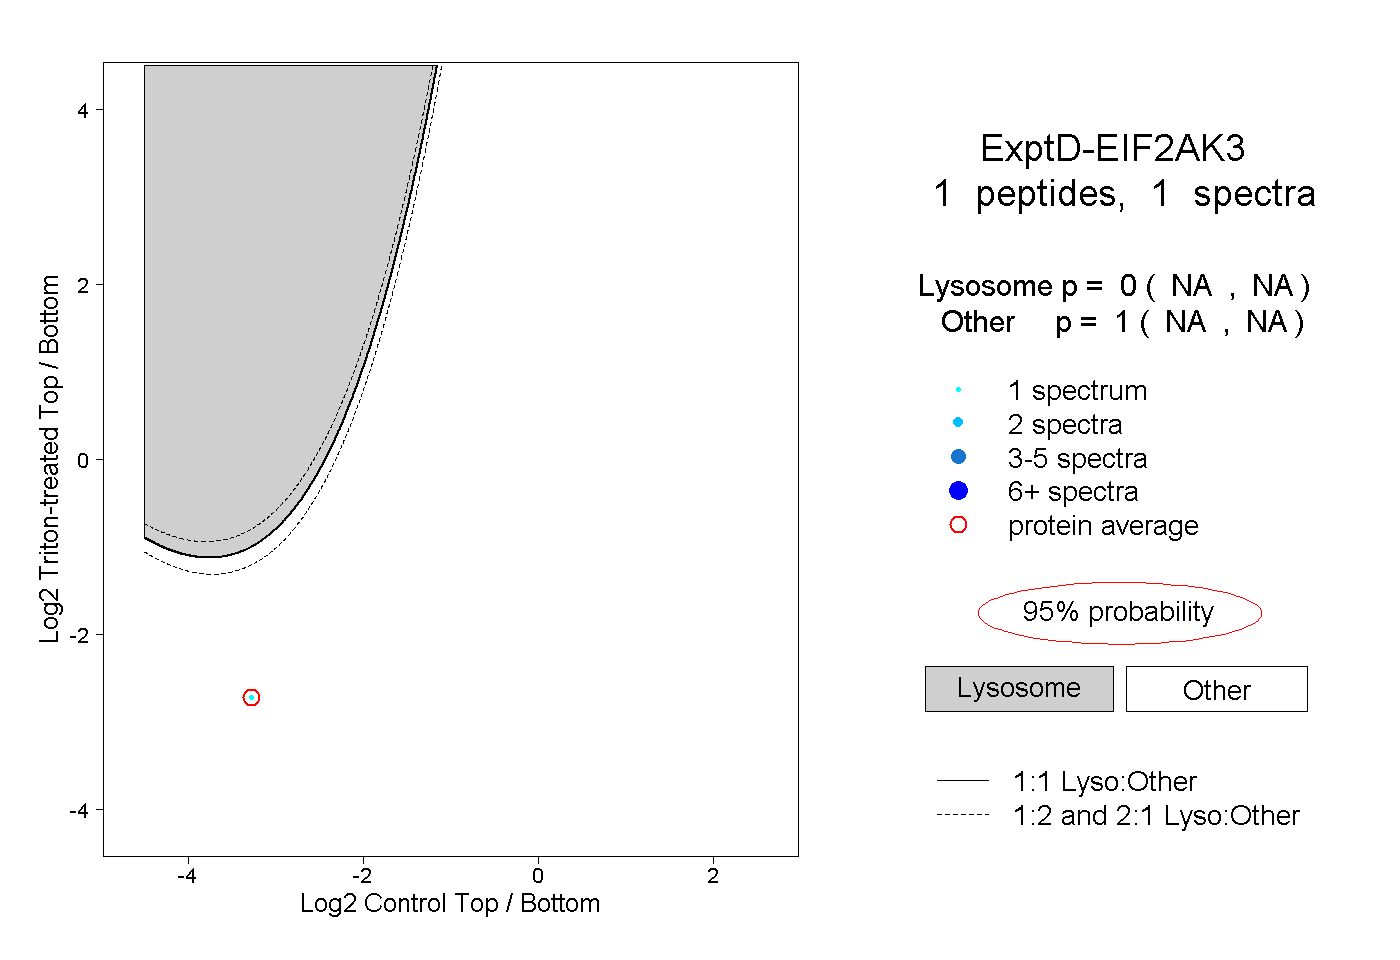
NA | NA
NA | NA