 4
4peptides
spectra
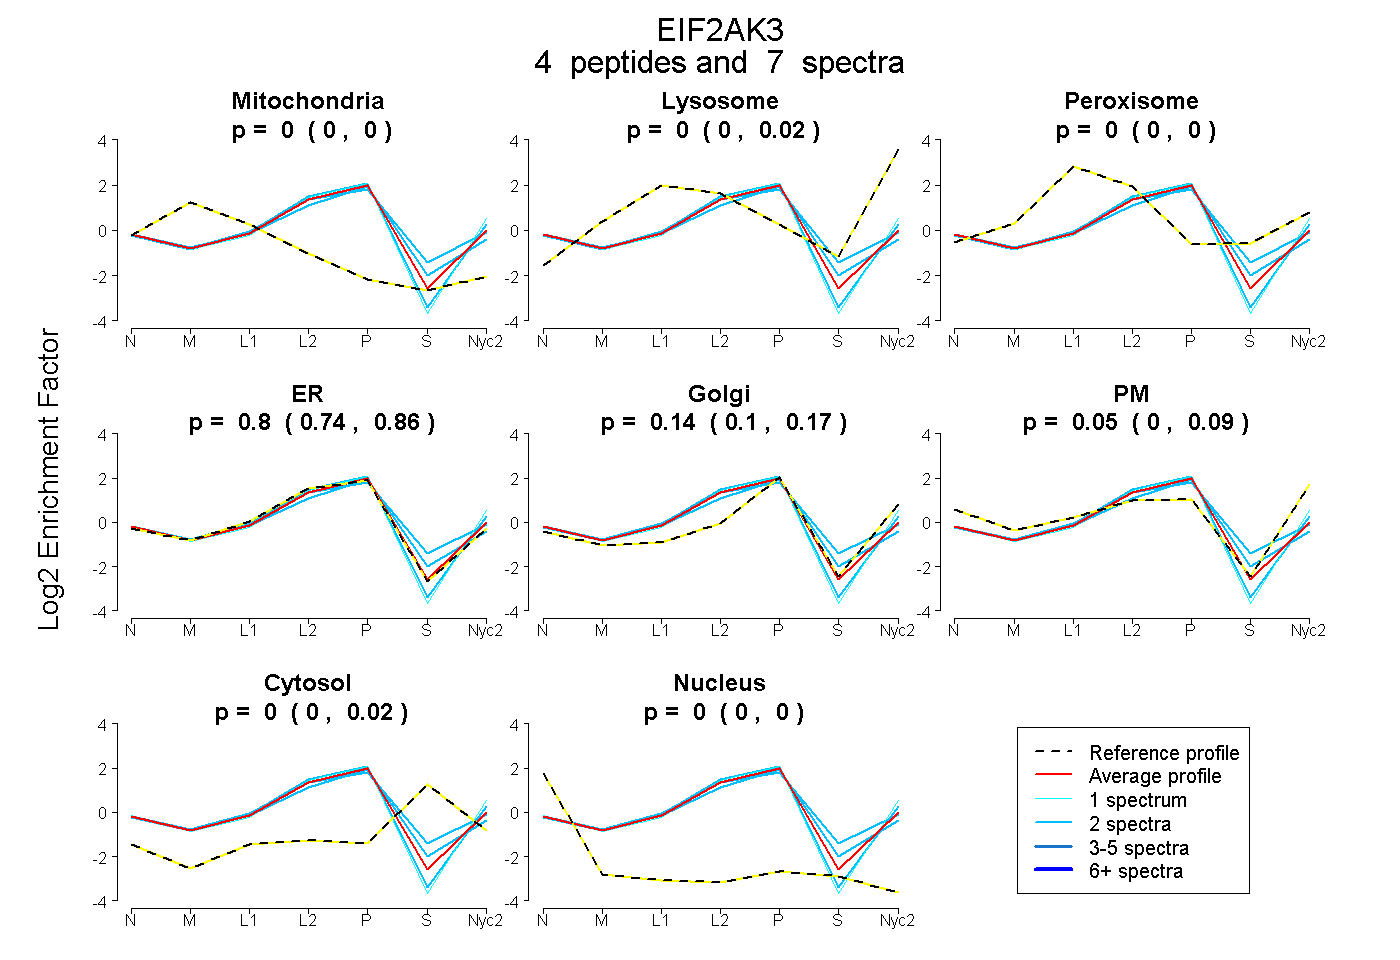
0.000 | 0.000
0.000 | 0.018
0.000 | 0.002
0.743 | 0.857
0.101 | 0.169
0.003 | 0.087
0.000 | 0.025
0.000 | 0.002
| Plot | Mito | Lyso | Perox | ER | Golgi | PM | Cytosol | Nucleus | |||||
| Expt A |
4 peptides |
7 spectra |
|
0.000 0.000 | 0.000 |
0.000 0.000 | 0.018 |
0.000 0.000 | 0.002 |
0.803 0.743 | 0.857 |
0.144 0.101 | 0.169 |
0.053 0.003 | 0.087 |
0.000 0.000 | 0.025 |
0.000 0.000 | 0.002 |
| 1 spectrum, SLVIISTLDGR | 0.000 | 0.000 | 0.000 | 0.698 | 0.136 | 0.166 | 0.000 | 0.000 | ||
| 2 spectra, WKPLIHSPSR | 0.000 | 0.000 | 0.000 | 0.833 | 0.082 | 0.000 | 0.085 | 0.000 | ||
| 2 spectra, ATESDDDVELRPR | 0.000 | 0.000 | 0.000 | 0.813 | 0.099 | 0.087 | 0.000 | 0.000 | ||
| 2 spectra, LFHPQPHR | 0.000 | 0.000 | 0.088 | 0.723 | 0.081 | 0.000 | 0.108 | 0.000 |
| Plot | Lyso | Other | |||||||||||
| Expt C |
1 peptide |
1 spectrum |
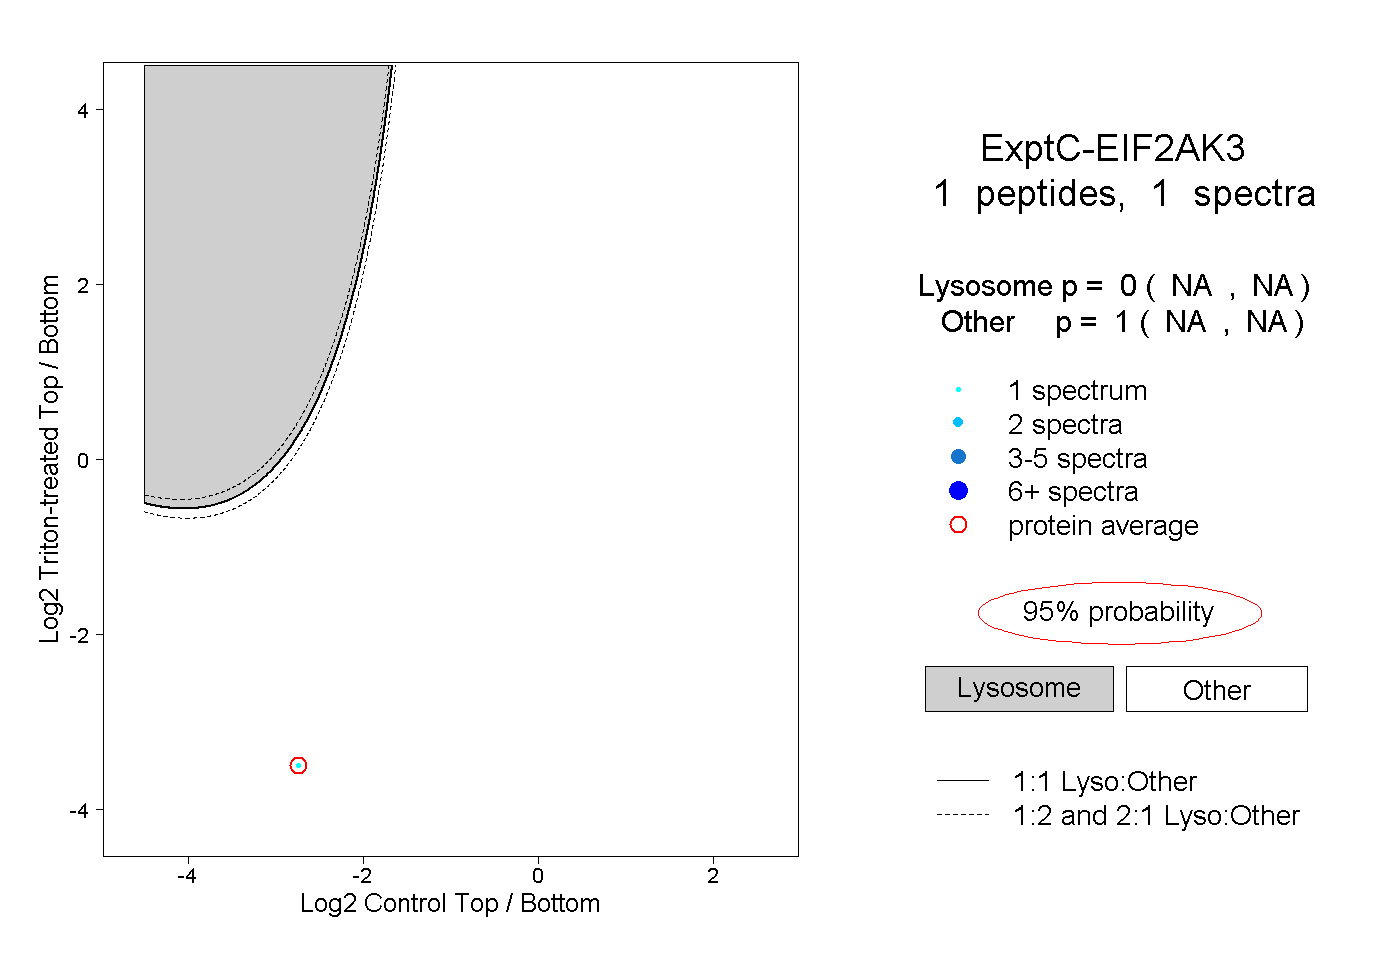 |
0.000 NA | NA |
1.000 NA | NA |
||||||||
| Plot | Lyso | Other | |||||||||||
| Expt D |
1 peptide |
1 spectrum |
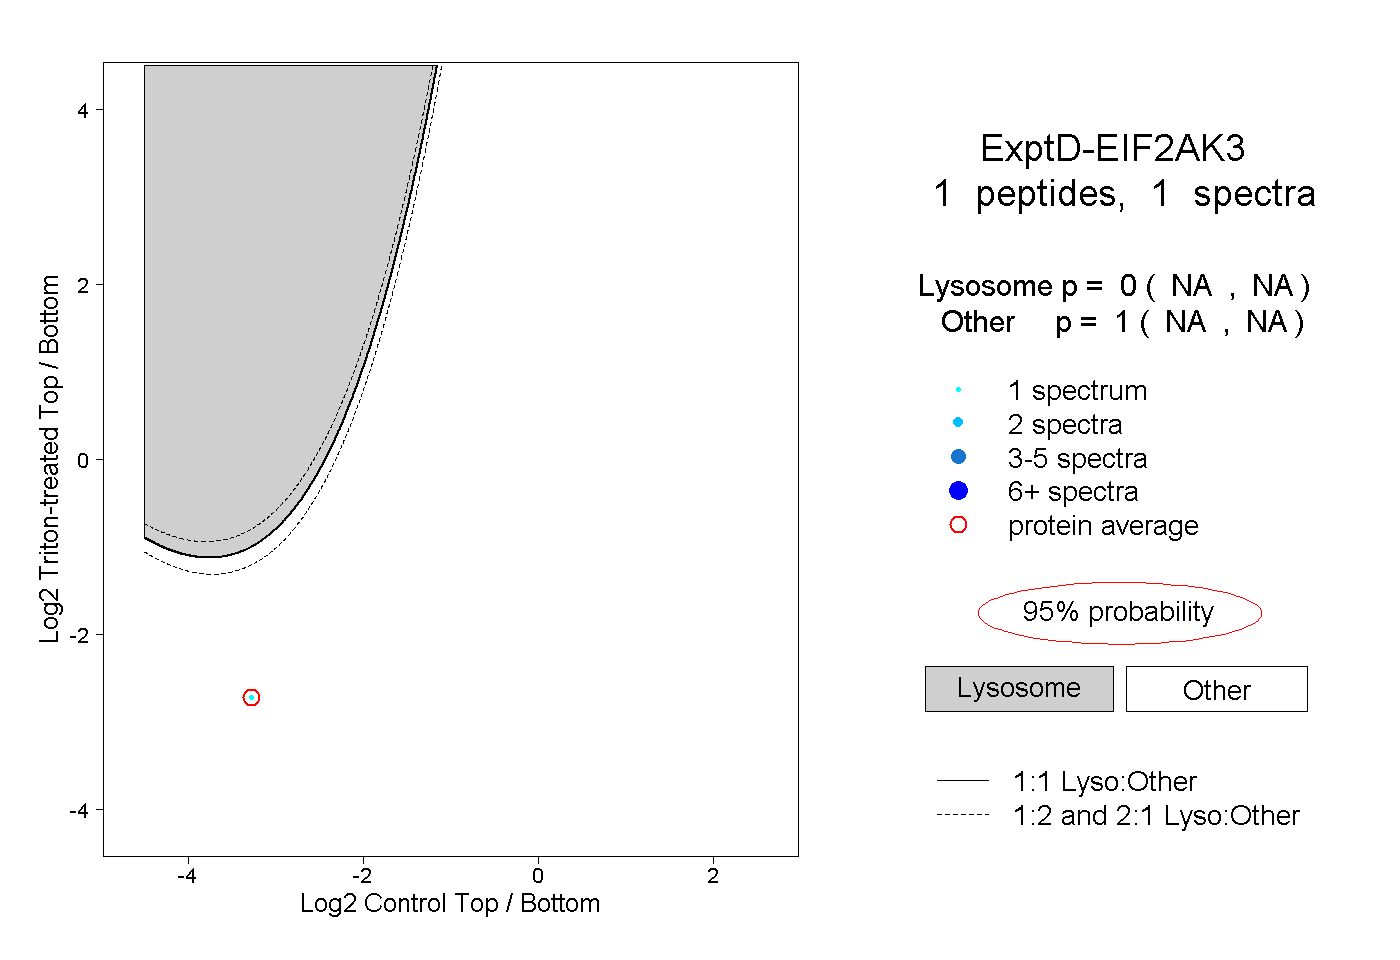 |
0.000 NA | NA |
1.000 NA | NA |