 42
42peptides
spectra
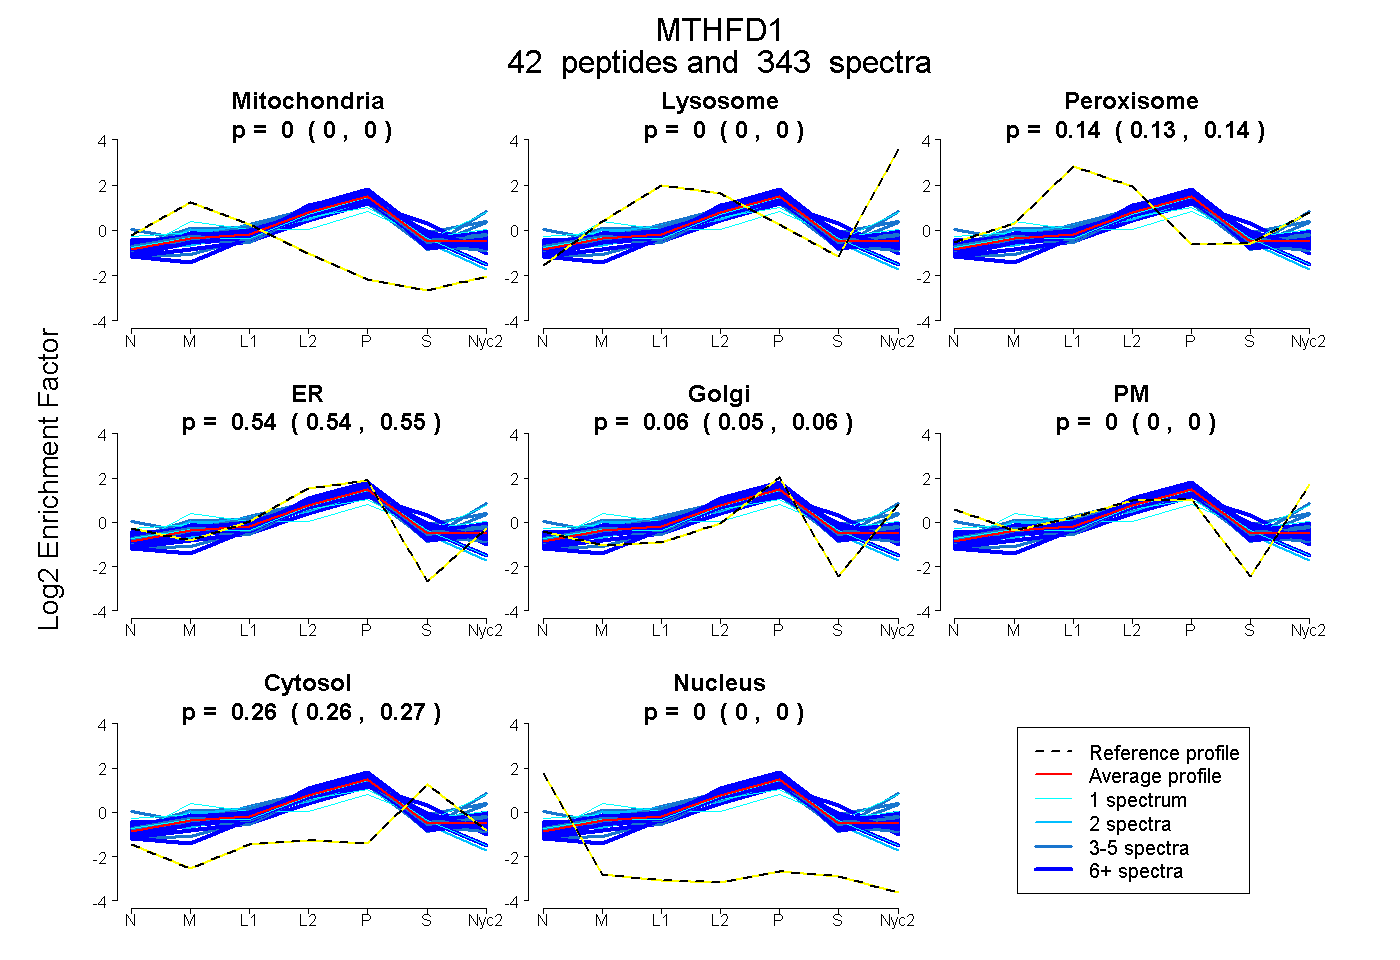
0.000 | 0.000
0.000 | 0.000
0.135 | 0.137
0.539 | 0.545
0.054 | 0.060
0.000 | 0.000
0.264 | 0.266
0.000 | 0.000
32peptides
spectra
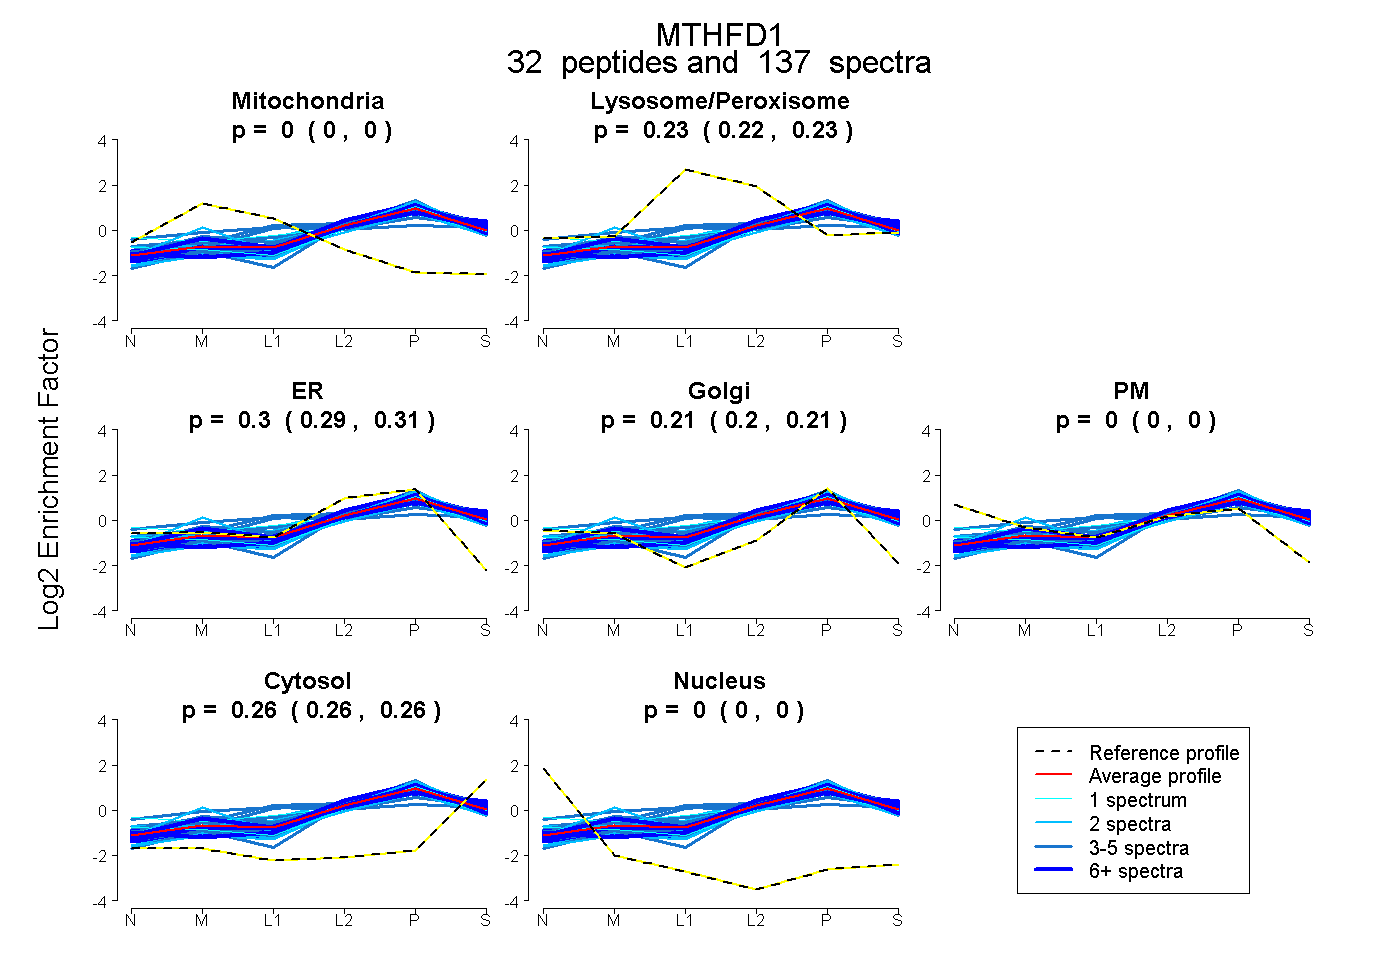
0.000 | 0.000
0.224 | 0.231
0.295 | 0.310
0.200 | 0.212
0.000 | 0.000
0.260 | 0.265
0.000 | 0.000
43peptides
spectra
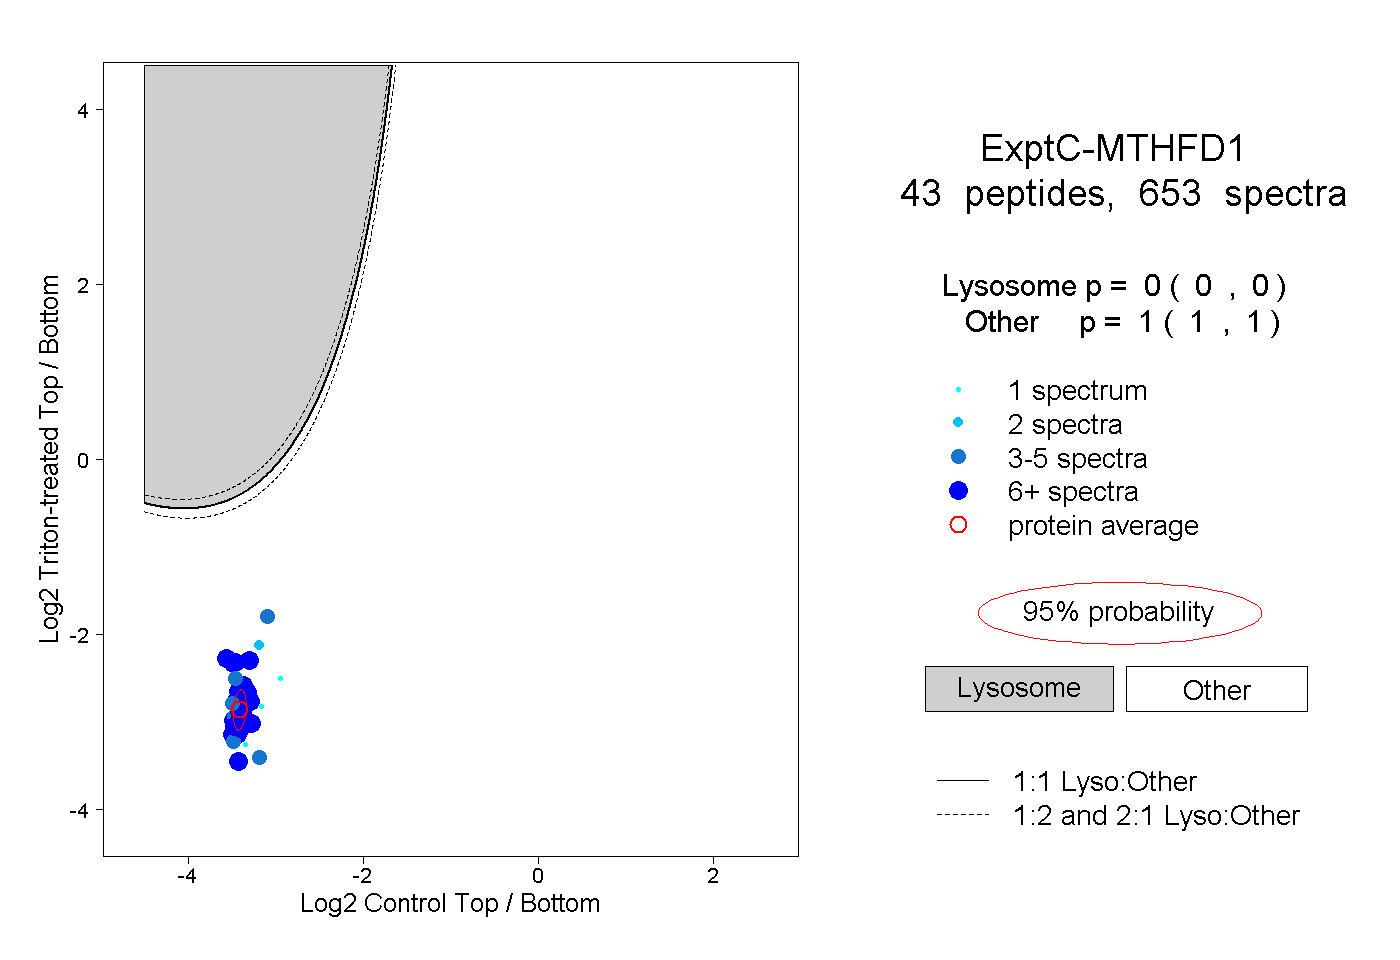
0.000 | 0.000
1.000 | 1.000
23peptides
spectra
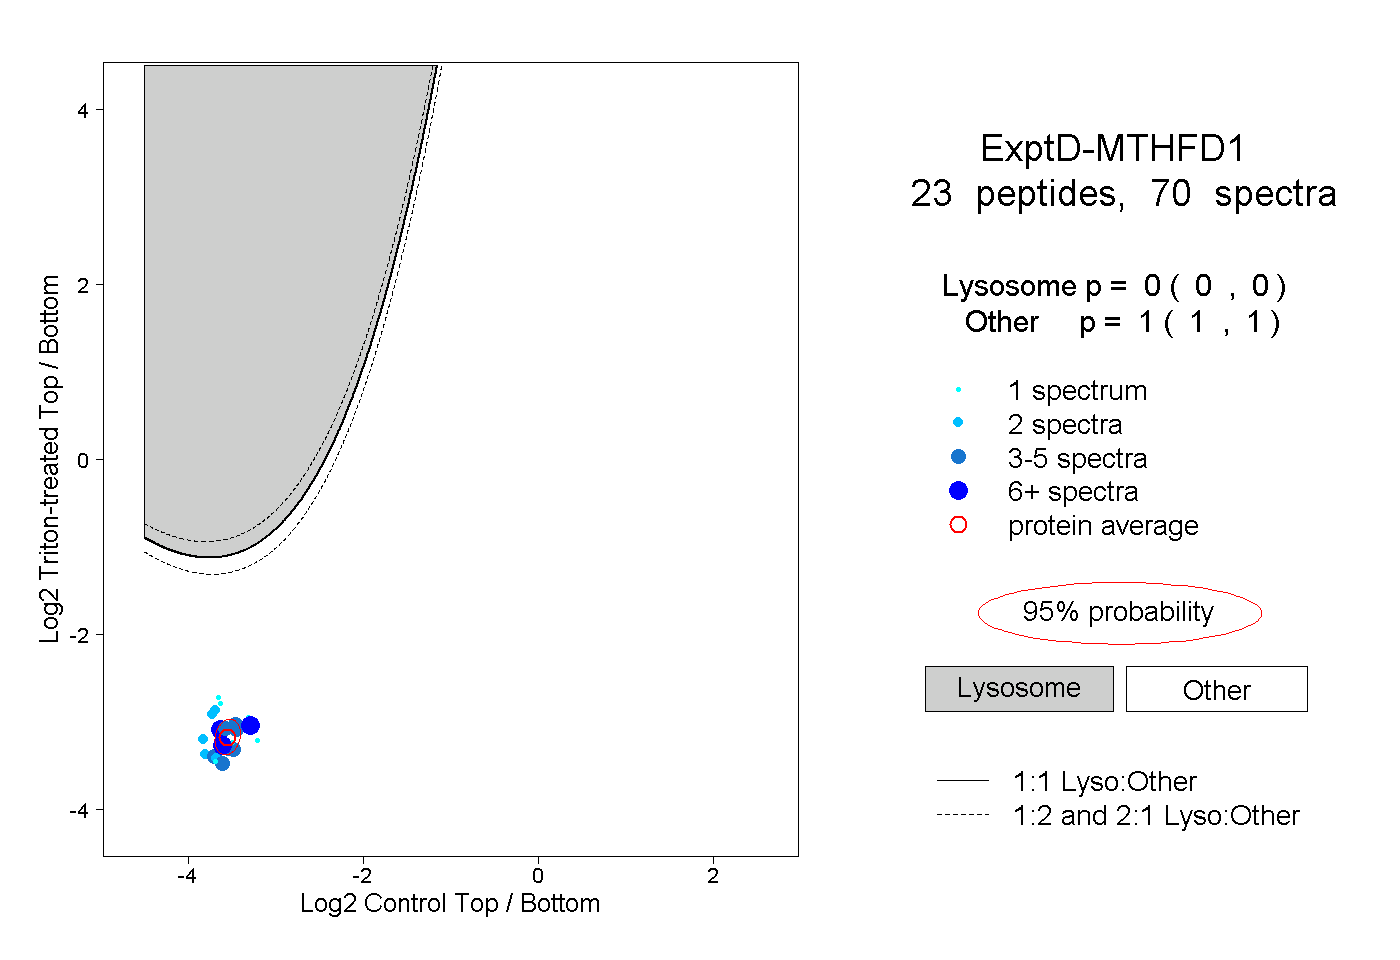
0.000 | 0.000
1.000 | 1.000