 9
9peptides
spectra
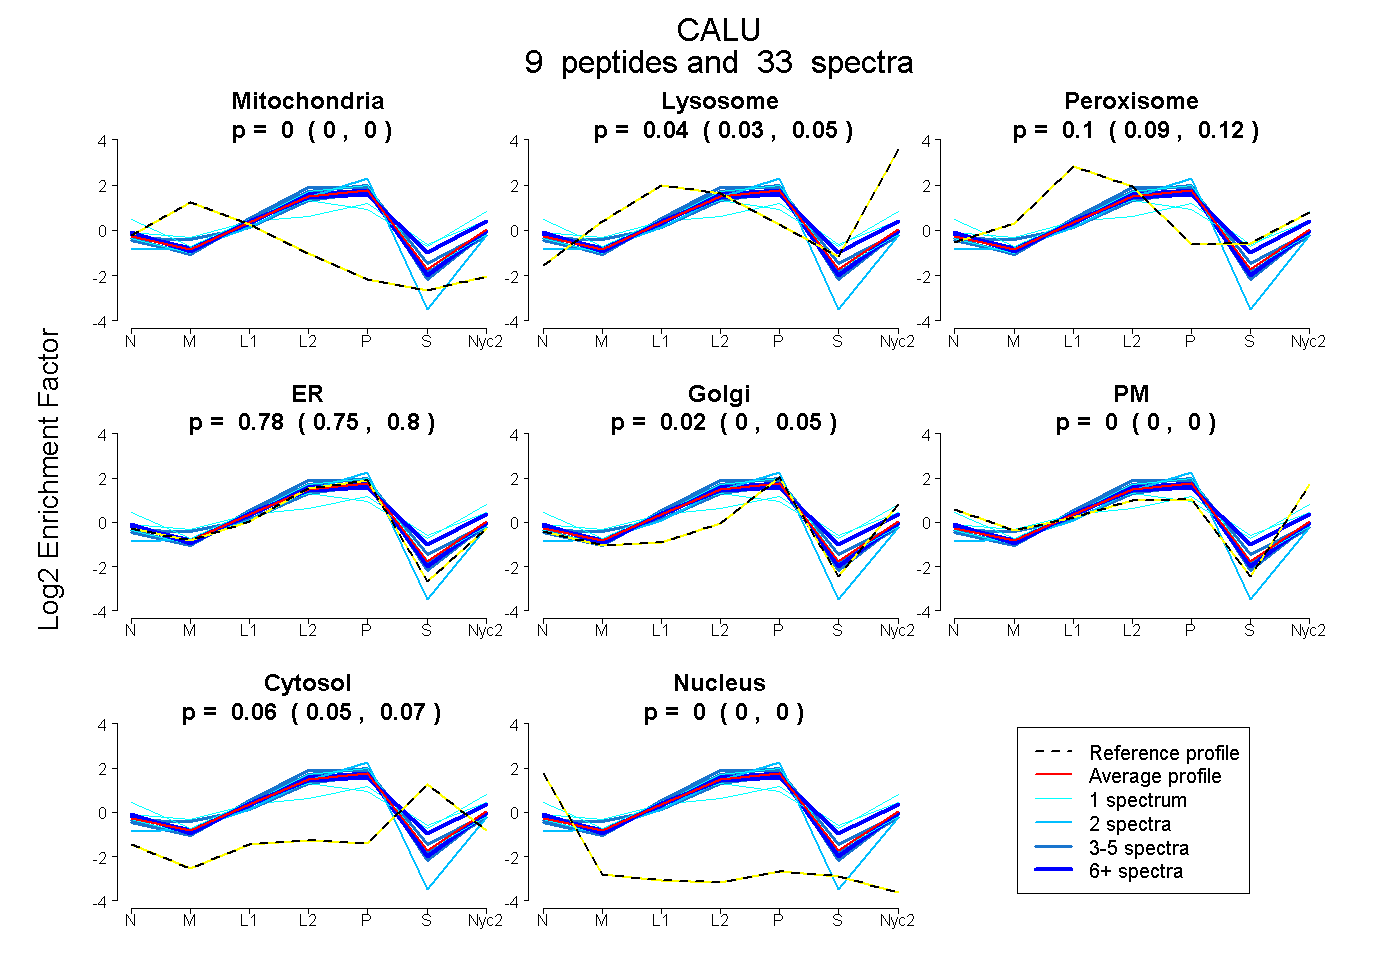
0.000 | 0.000
0.025 | 0.054
0.086 | 0.116
0.750 | 0.799
0.000 | 0.045
0.000 | 0.000
0.048 | 0.067
0.000 | 0.000
2peptides
spectra
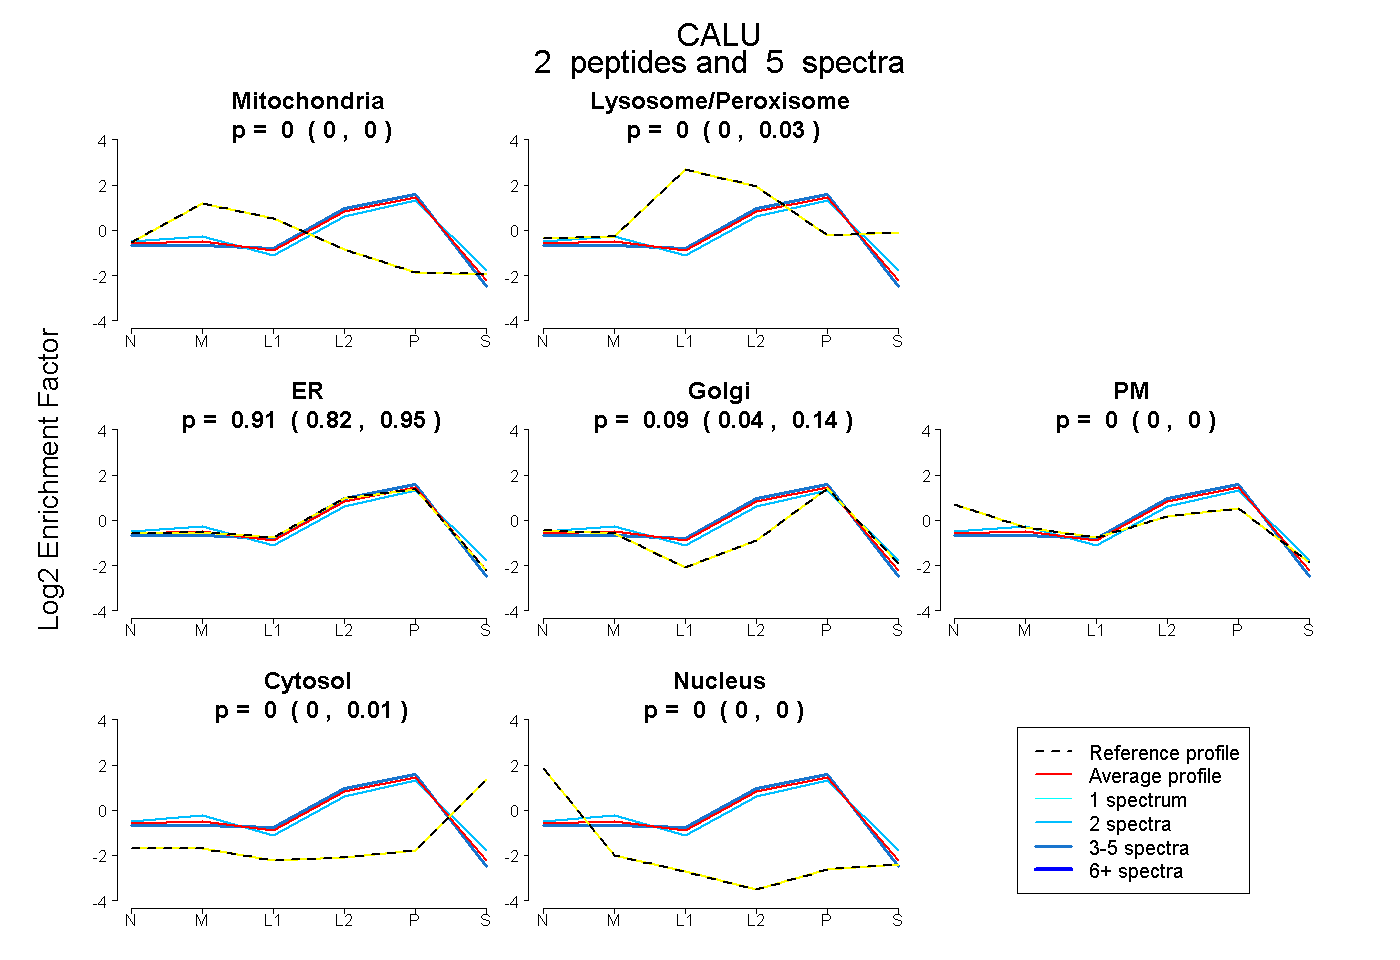
0.000 | 0.000
0.000 | 0.027
0.822 | 0.946
0.039 | 0.141
0.000 | 0.000
0.000 | 0.007
0.000 | 0.000
10peptides
spectra
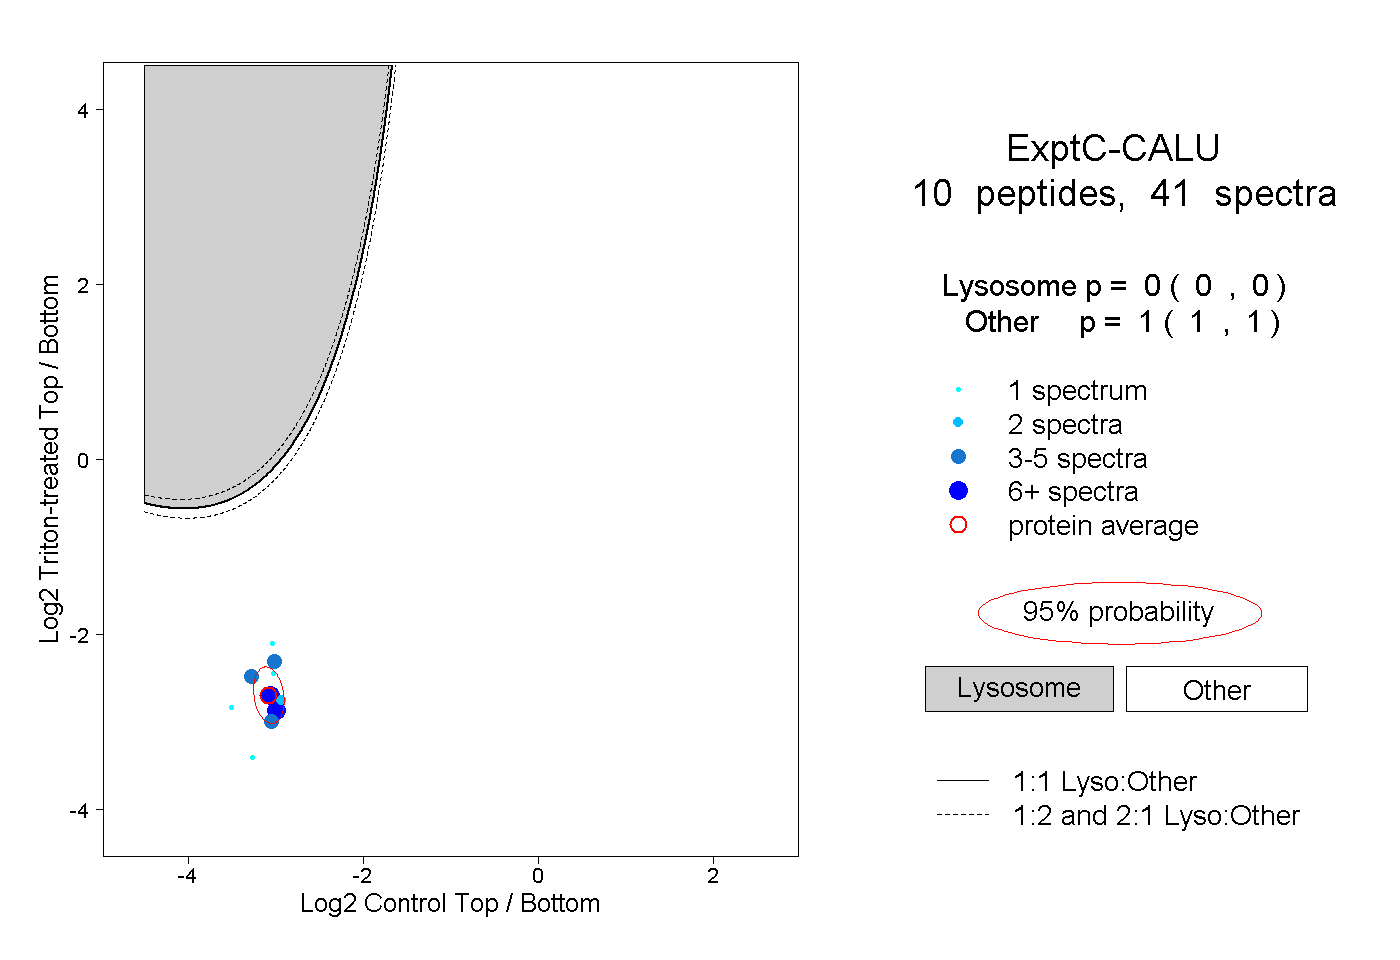
0.000 | 0.000
1.000 | 1.000
4peptides
spectra
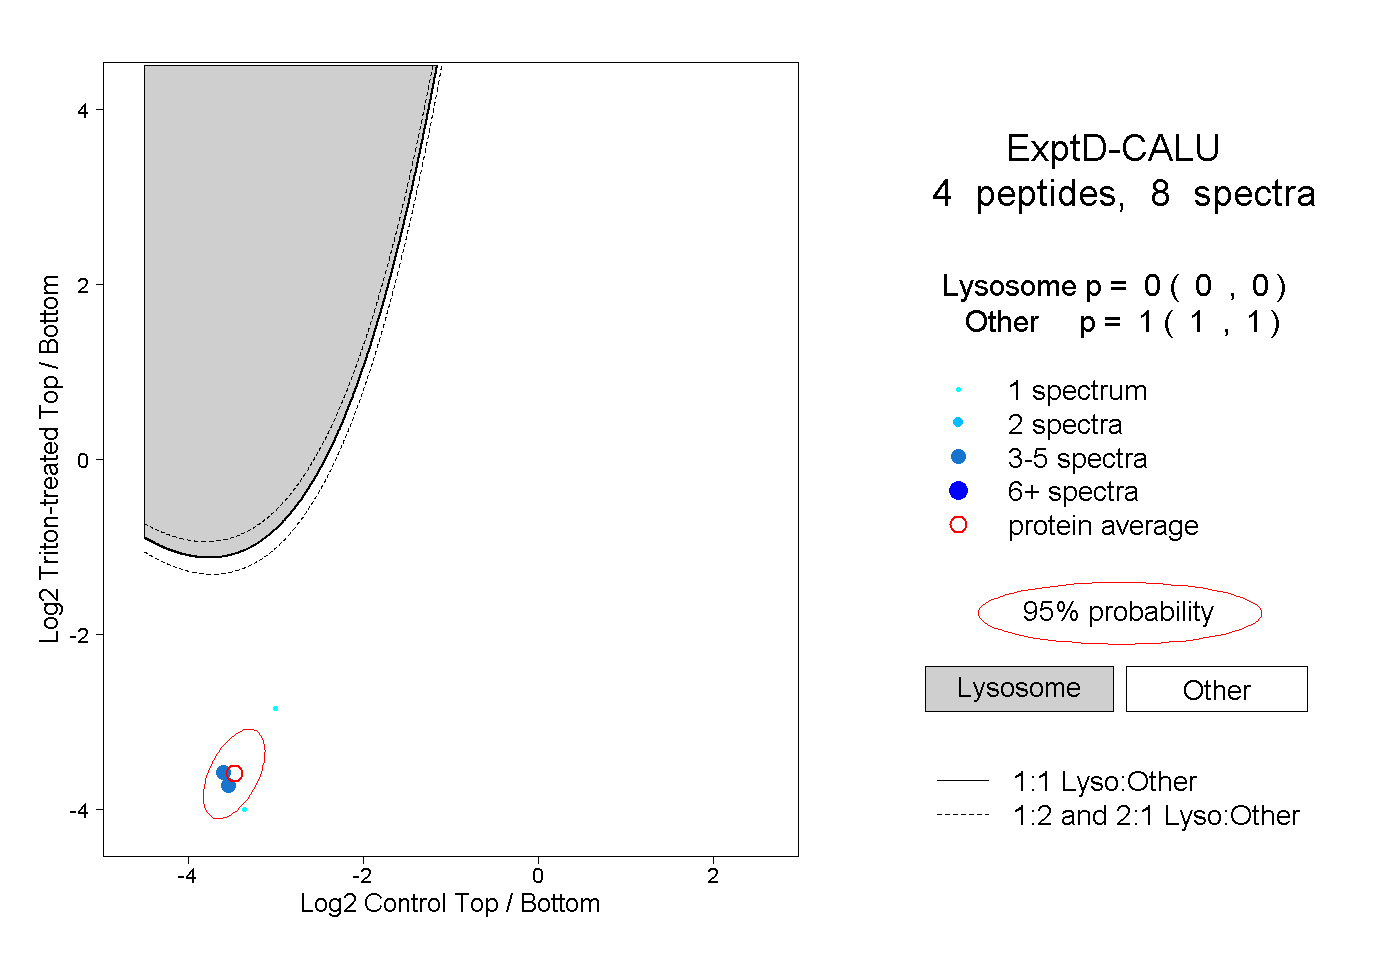
0.000 | 0.000
1.000 | 1.000