 9
9peptides
spectra
0.000 | 0.000
0.025 | 0.054
0.086 | 0.116
0.750 | 0.799
0.000 | 0.045
0.000 | 0.000
0.048 | 0.067
0.000 | 0.000
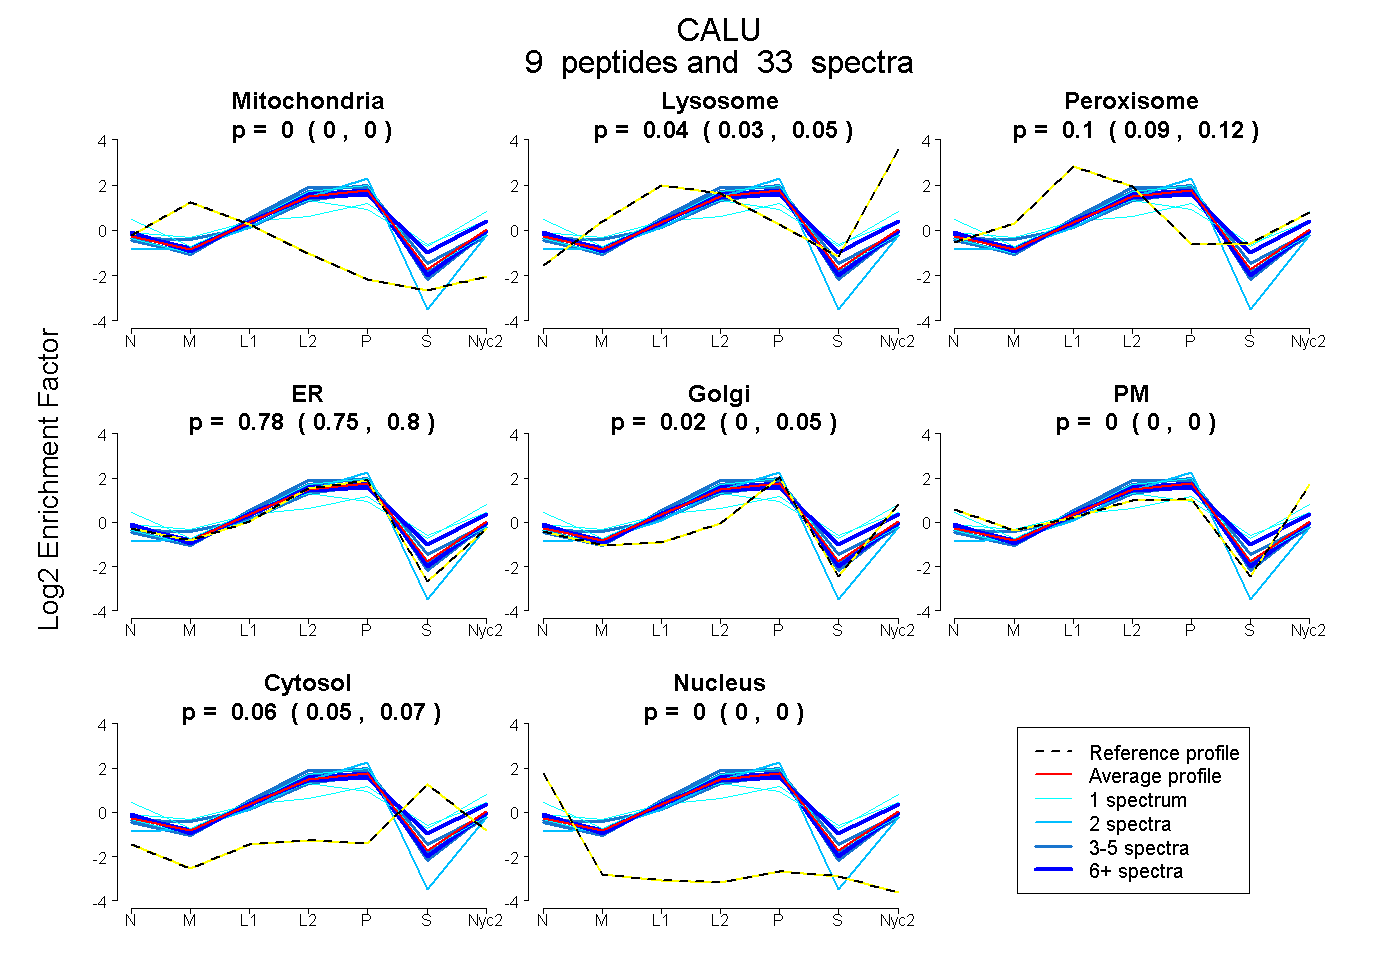
| Plot | Mito | Lyso | Perox | ER | Golgi | PM | Cytosol | Nucleus | |||||
| Expt A |
9 peptides |
33 spectra |
|
0.000 0.000 | 0.000 |
0.043 0.025 | 0.054 |
0.100 0.086 | 0.116 |
0.780 0.750 | 0.799 |
0.018 0.000 | 0.045 |
0.000 0.000 | 0.000 |
0.059 0.048 | 0.067 |
0.000 0.000 | 0.000 |
| 2 spectra, LGMIVDK | 0.000 | 0.000 | 0.000 | 0.981 | 0.019 | 0.000 | 0.000 | 0.000 | ||
| 4 spectra, DIVVQETMEDIDK | 0.002 | 0.000 | 0.121 | 0.747 | 0.073 | 0.000 | 0.056 | 0.000 | ||
| 1 spectrum, VHHEPQLSDK | 0.000 | 0.000 | 0.235 | 0.155 | 0.000 | 0.462 | 0.148 | 0.000 | ||
| 1 spectrum, DGDLIATK | 0.000 | 0.000 | 0.380 | 0.027 | 0.482 | 0.000 | 0.111 | 0.000 | ||
| 4 spectra, DWILPSDYDHAEAEAR | 0.000 | 0.007 | 0.167 | 0.776 | 0.000 | 0.000 | 0.050 | 0.000 | ||
| 1 spectrum, SFDQLTPEESK | 0.000 | 0.000 | 0.107 | 0.846 | 0.000 | 0.000 | 0.047 | 0.000 | ||
| 5 spectra, EEFTAFLHPEEYDYMK | 0.000 | 0.015 | 0.074 | 0.904 | 0.000 | 0.000 | 0.007 | 0.000 | ||
| 6 spectra, WIHEDVER | 0.000 | 0.072 | 0.136 | 0.581 | 0.000 | 0.082 | 0.130 | 0.000 | ||
| 9 spectra, EQFVEFR | 0.000 | 0.010 | 0.101 | 0.828 | 0.003 | 0.025 | 0.033 | 0.000 |
| Plot | Mito | Lyso or Perox | ER | Golgi | PM | Cytosol | Nucleus | ||||||
| Expt B |
2 peptides |
5 spectra |
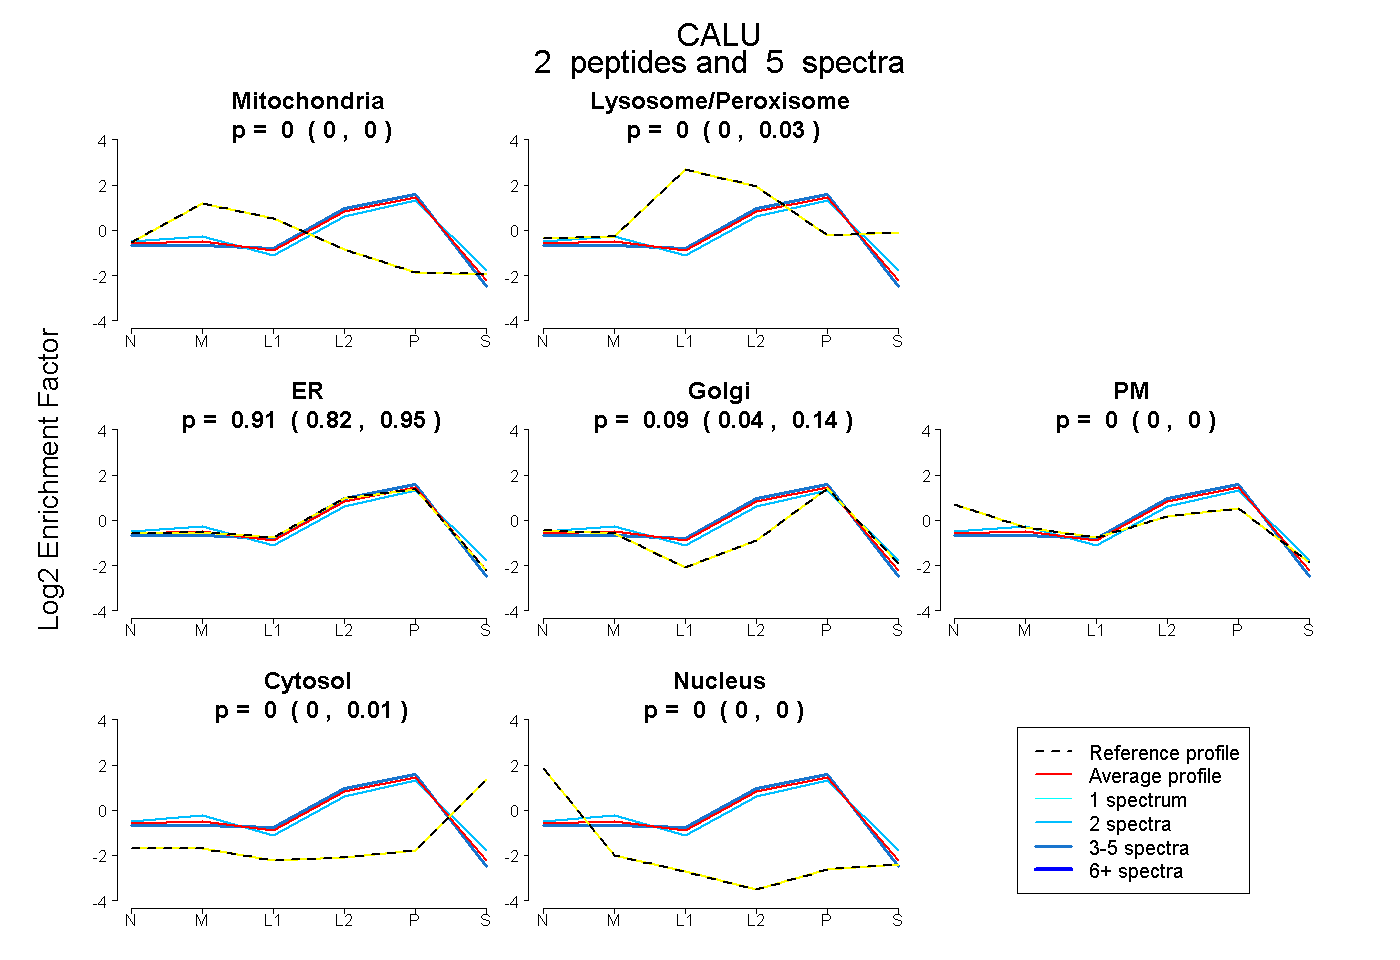 |
0.000 0.000 | 0.000 |
0.000 0.000 | 0.027 |
0.906 0.822 | 0.946 |
0.094 0.039 | 0.141 |
0.000 0.000 | 0.000 |
0.000 0.000 | 0.007 |
0.000 0.000 | 0.000 |
|||
| Plot | Lyso | Other | |||||||||||
| Expt C |
10 peptides |
41 spectra |
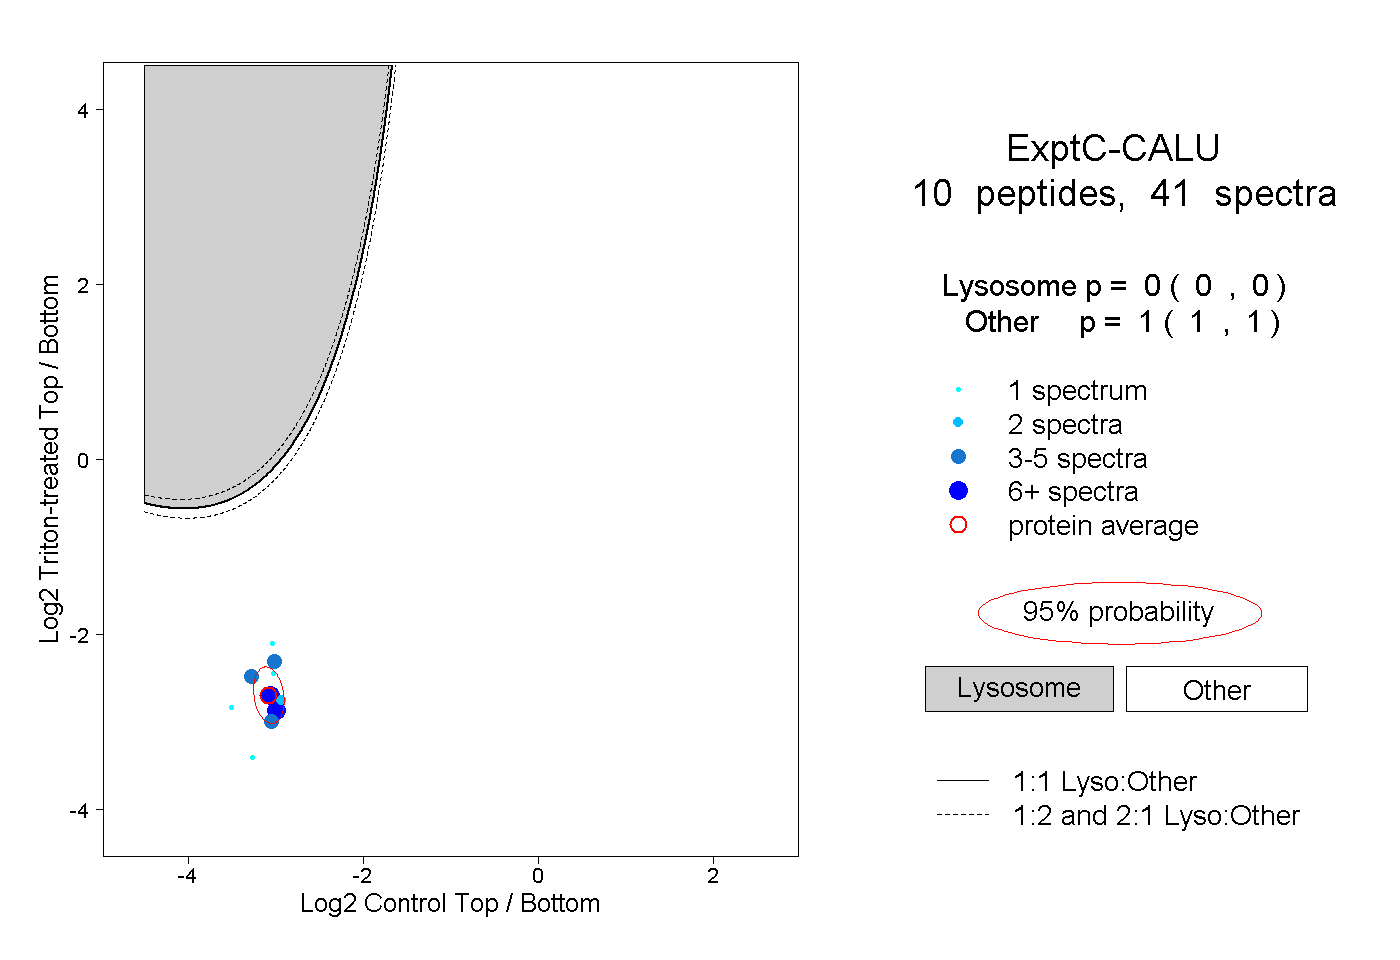 |
0.000 0.000 | 0.000 |
1.000 1.000 | 1.000 |
||||||||
| Plot | Lyso | Other | |||||||||||
| Expt D |
4 peptides |
8 spectra |
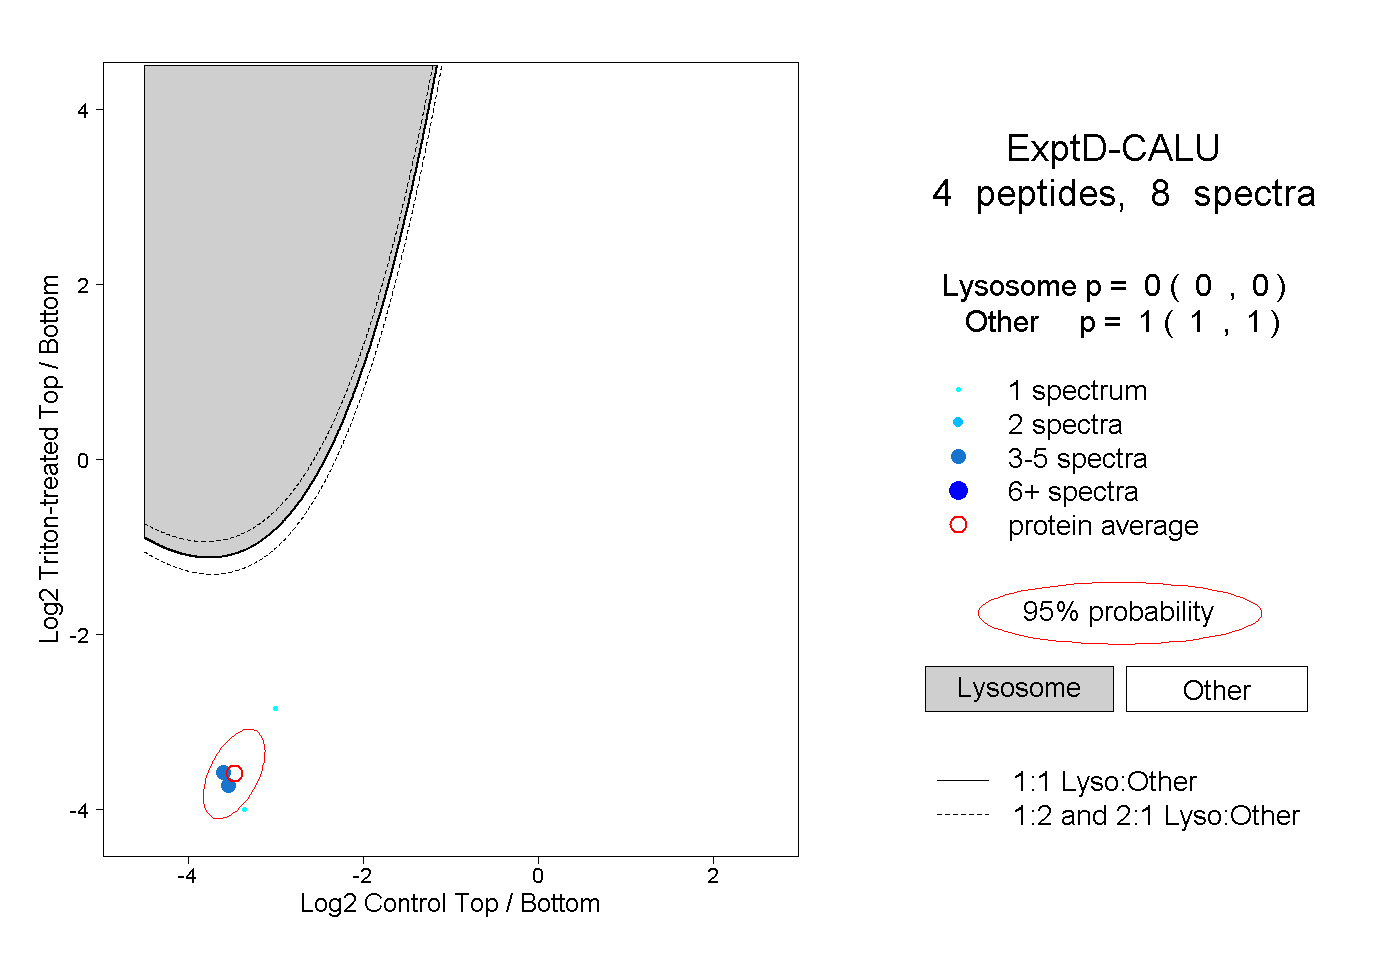 |
0.000 0.000 | 0.000 |
1.000 1.000 | 1.000 |