 47
47peptides
spectra
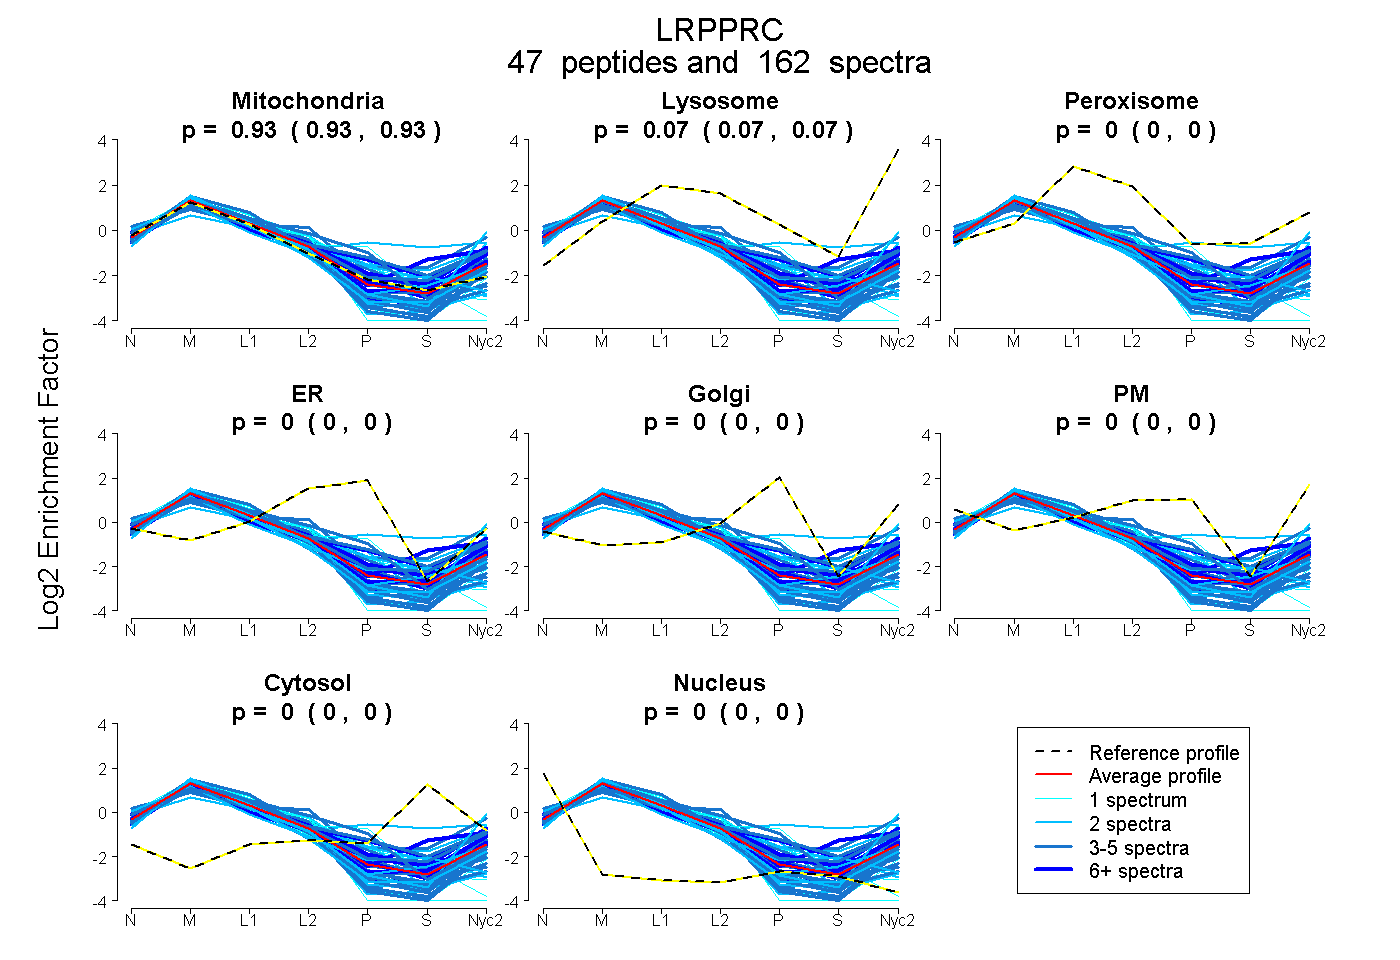
0.930 | 0.934
0.066 | 0.069
0.000 | 0.000
0.000 | 0.000
0.000 | 0.000
0.000 | 0.000
0.000 | 0.000
0.000 | 0.000
32peptides
spectra
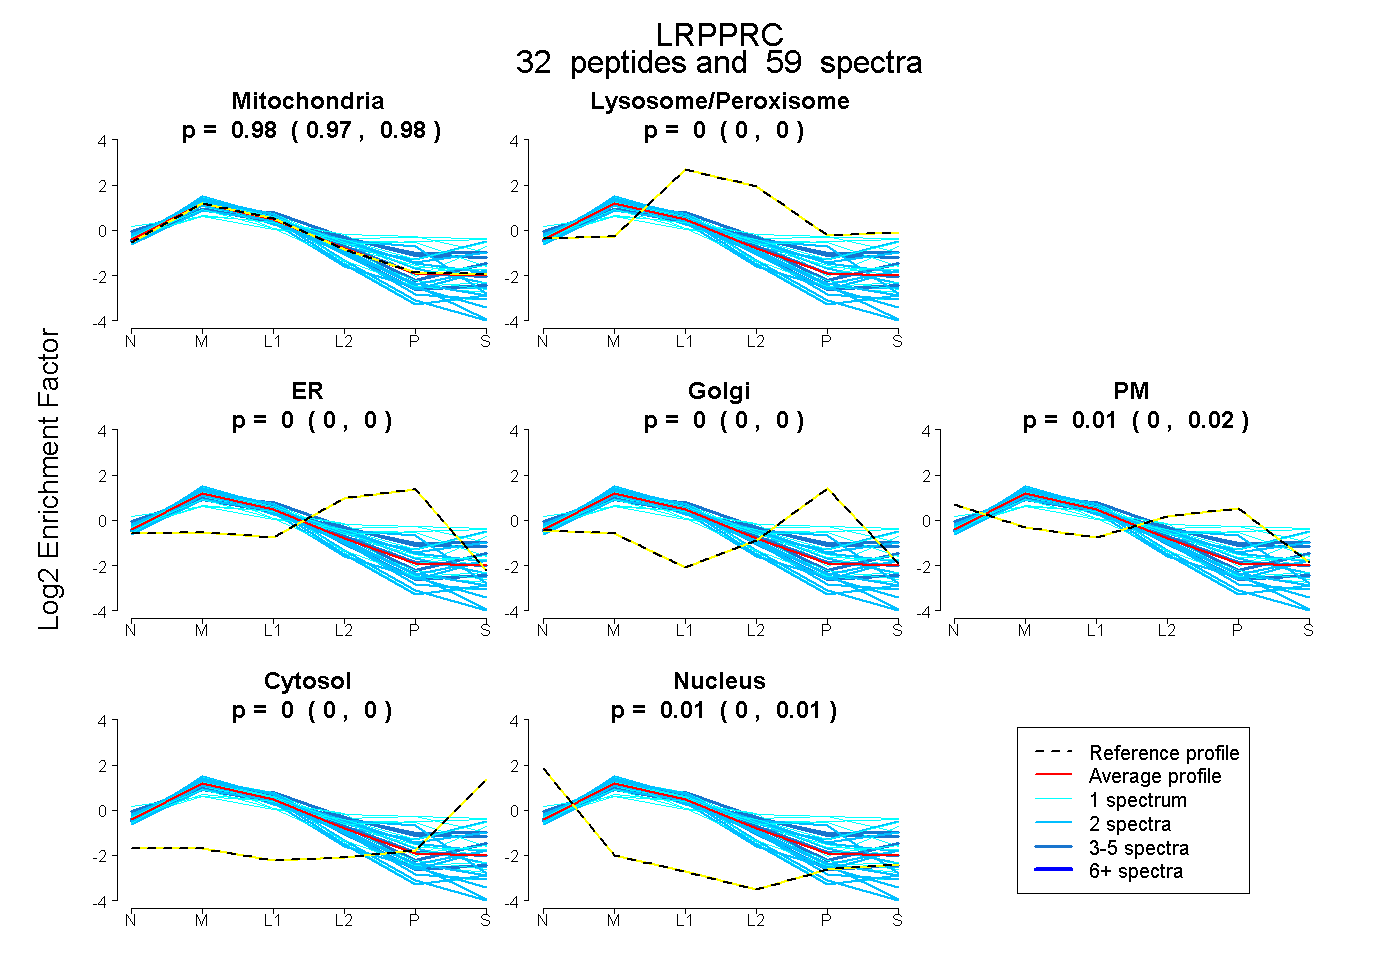
0.973 | 0.985
0.000 | 0.000
0.000 | 0.000
0.000 | 0.000
0.003 | 0.020
0.000 | 0.000
0.005 | 0.012
70peptides
spectra
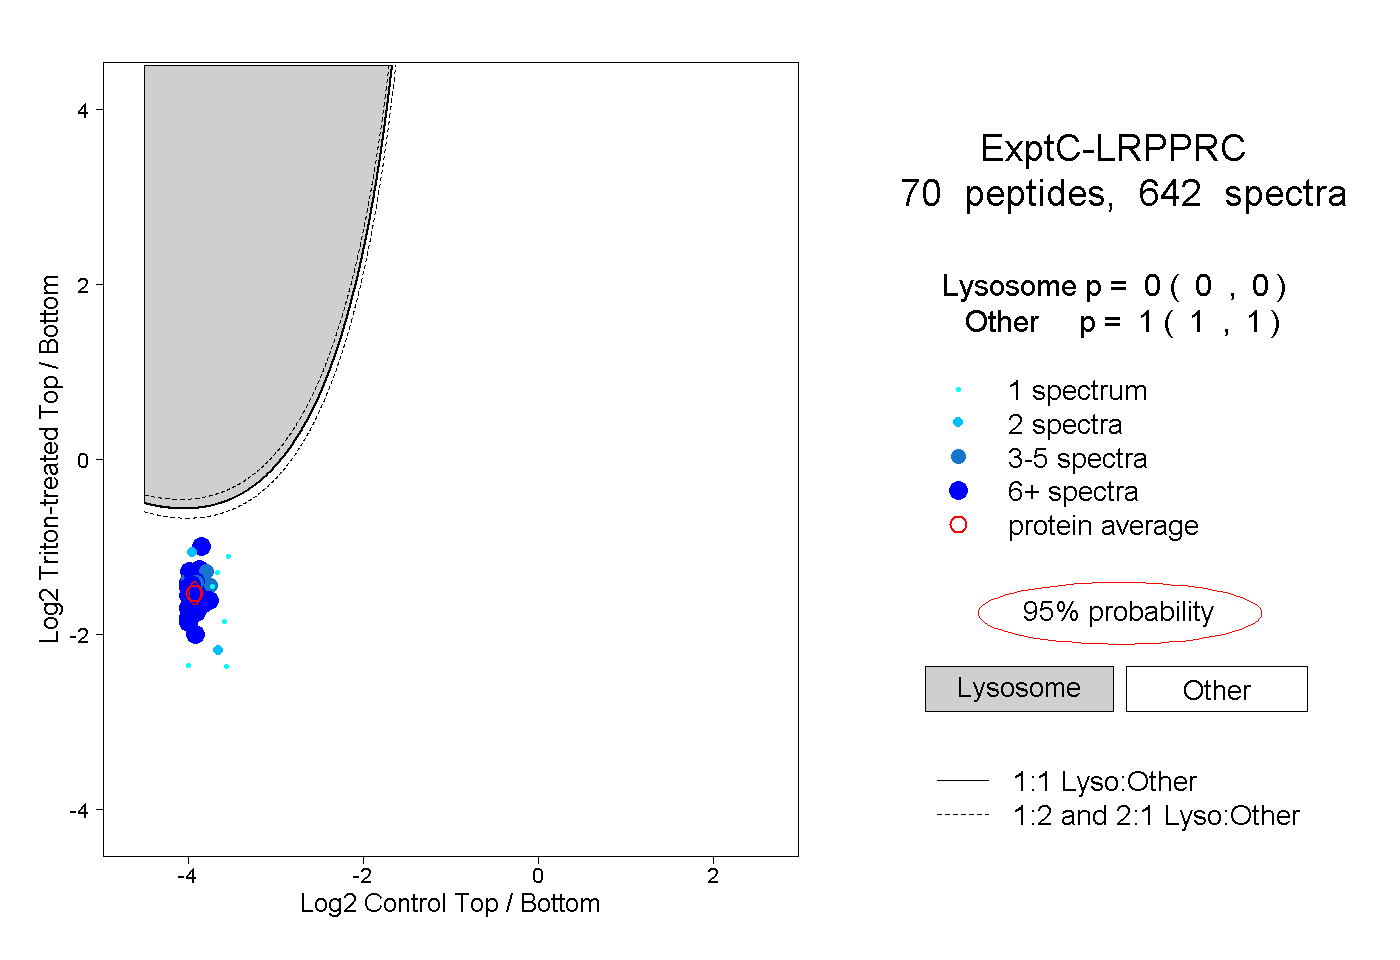
0.000 | 0.000
1.000 | 1.000
27peptides
spectra
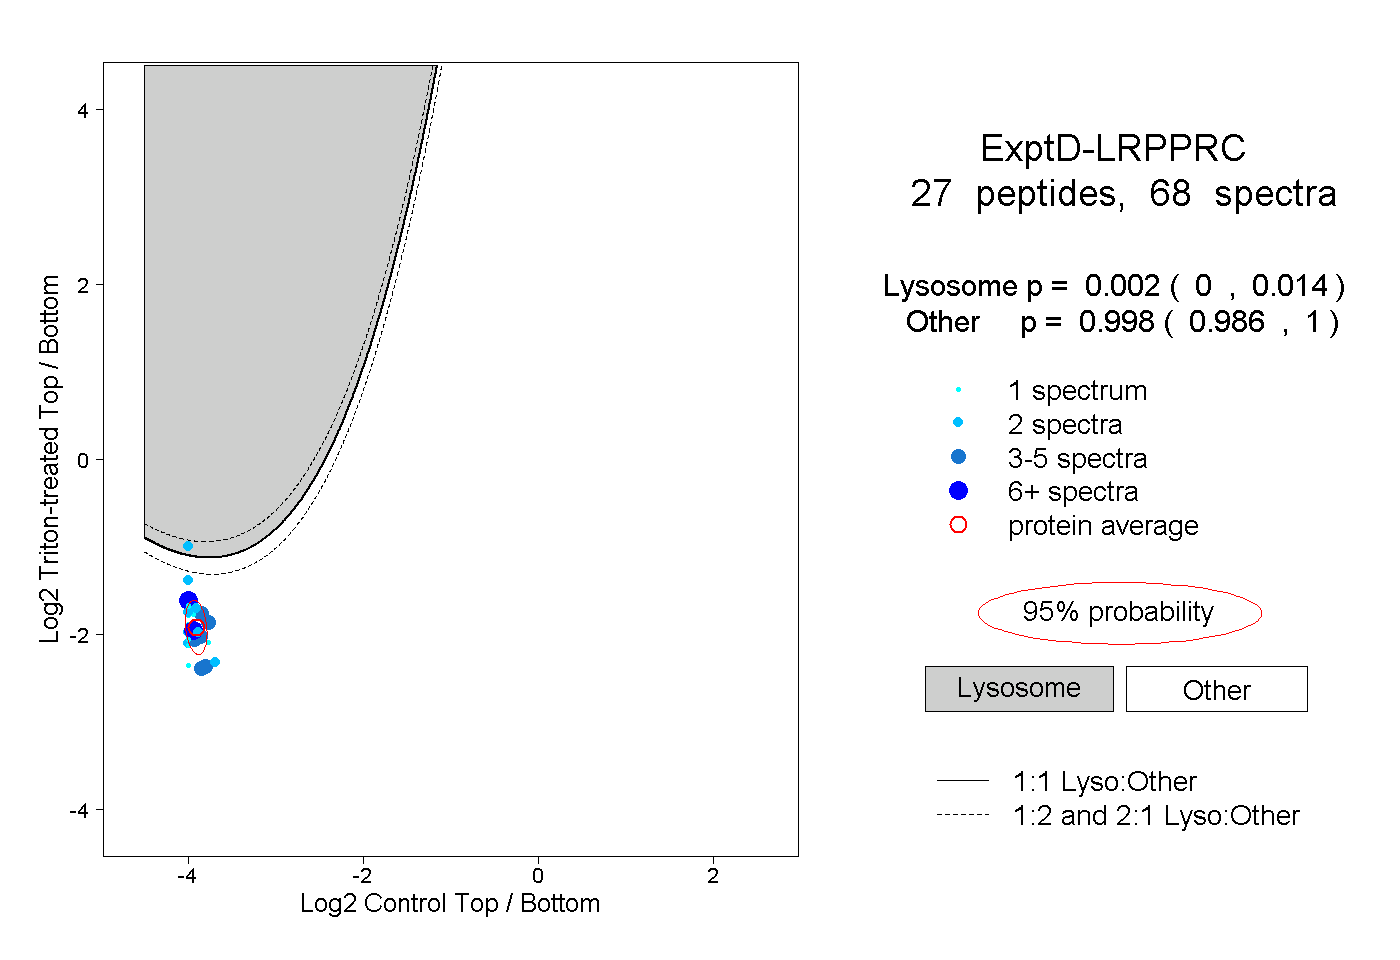
0.000 | 0.014
0.986 | 1.000