 33
33peptides
spectra
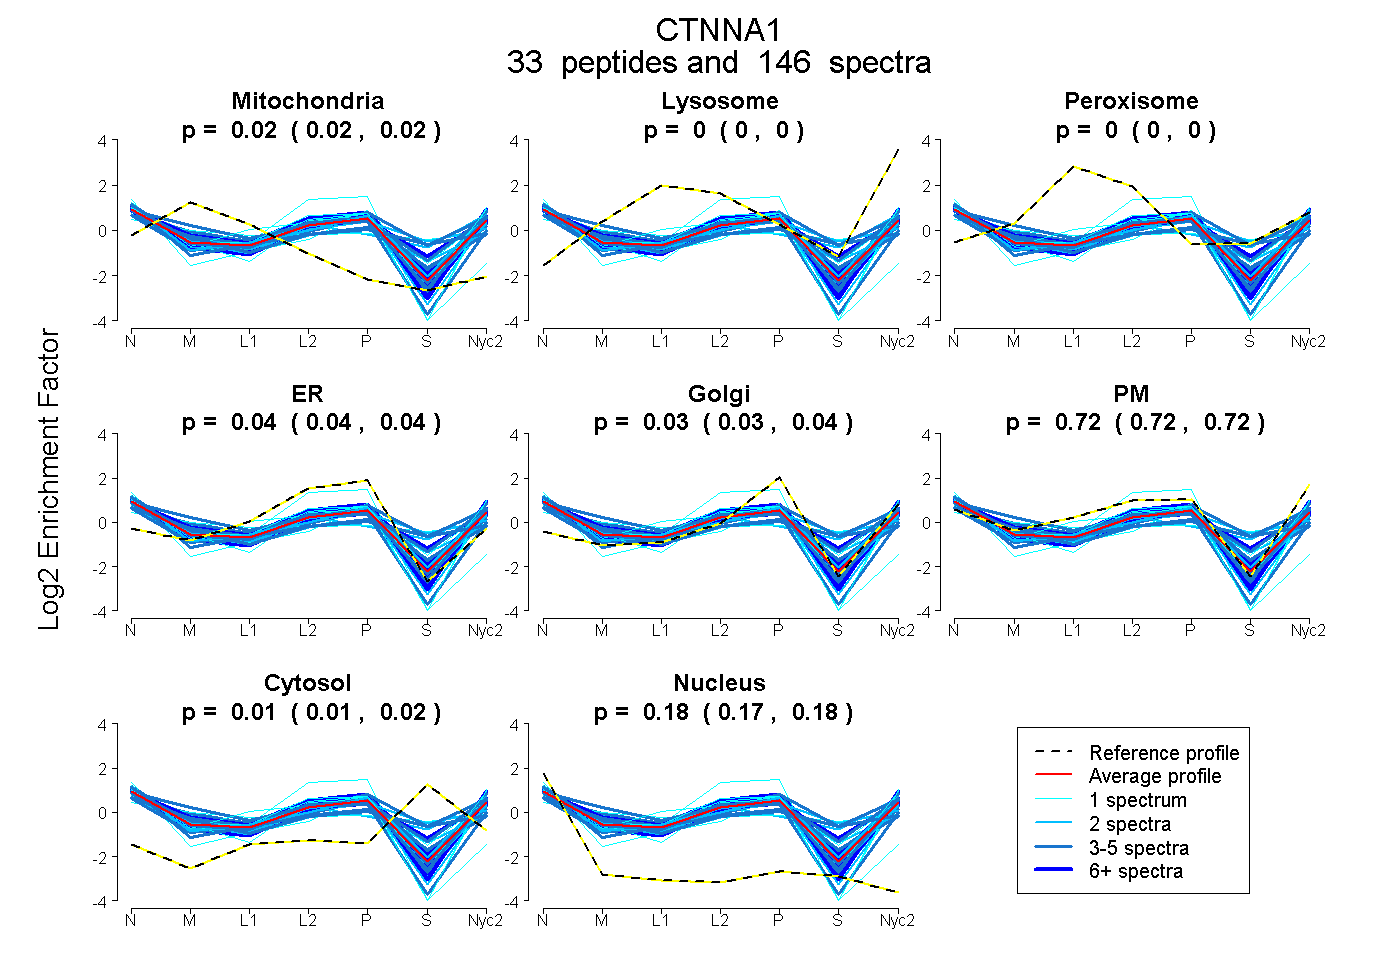
0.016 | 0.021
0.000 | 0.000
0.000 | 0.000
0.036 | 0.044
0.025 | 0.036
0.715 | 0.723
0.008 | 0.017
0.175 | 0.179
18peptides
spectra
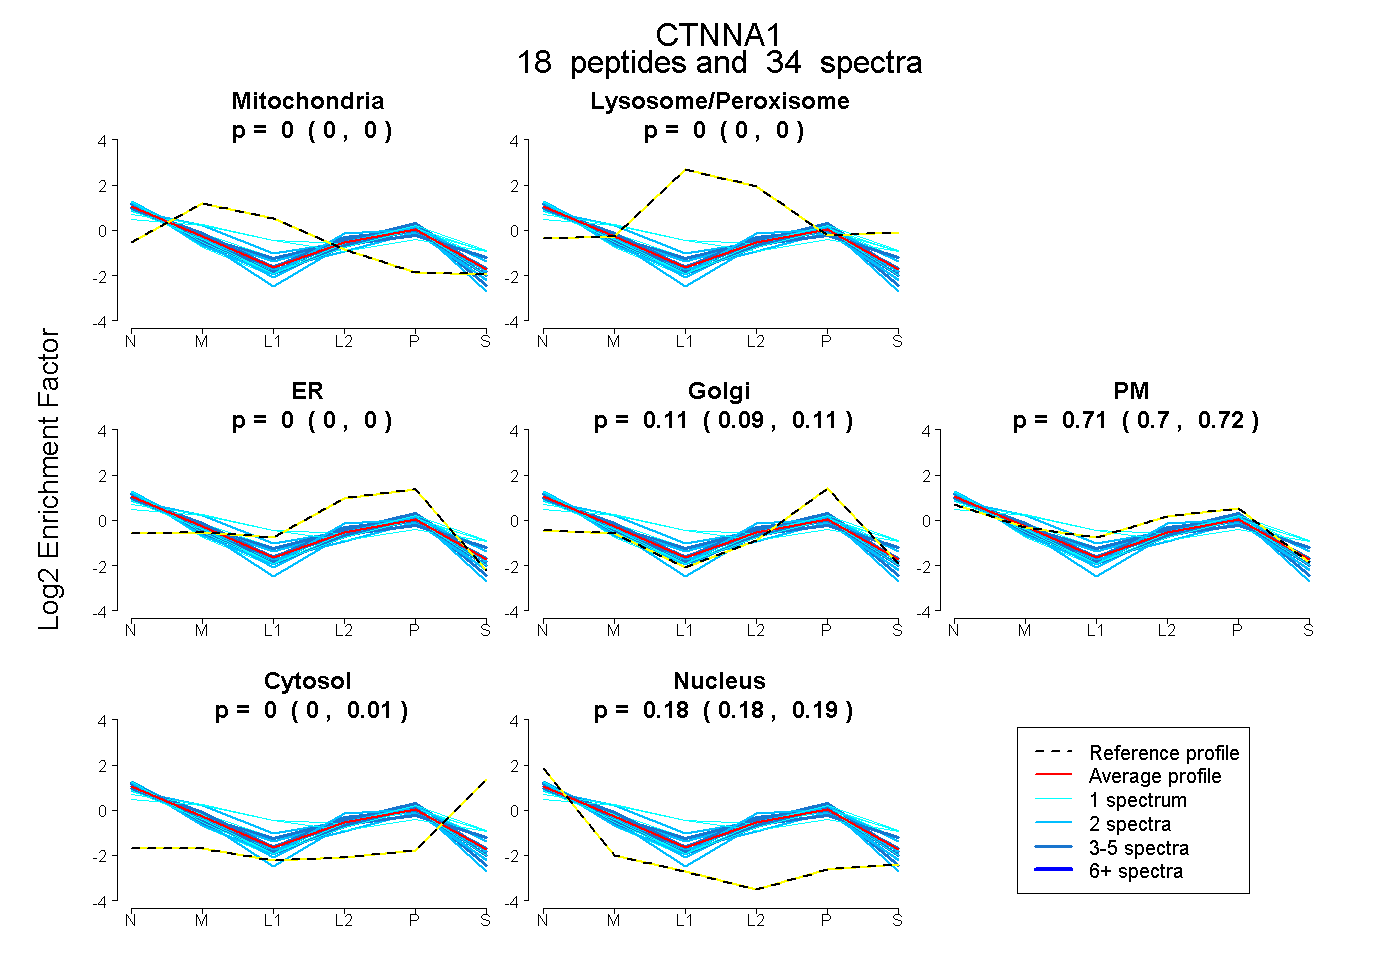
0.000 | 0.000
0.000 | 0.000
0.000 | 0.000
0.095 | 0.115
0.698 | 0.720
0.000 | 0.006
0.179 | 0.186
35peptides
spectra
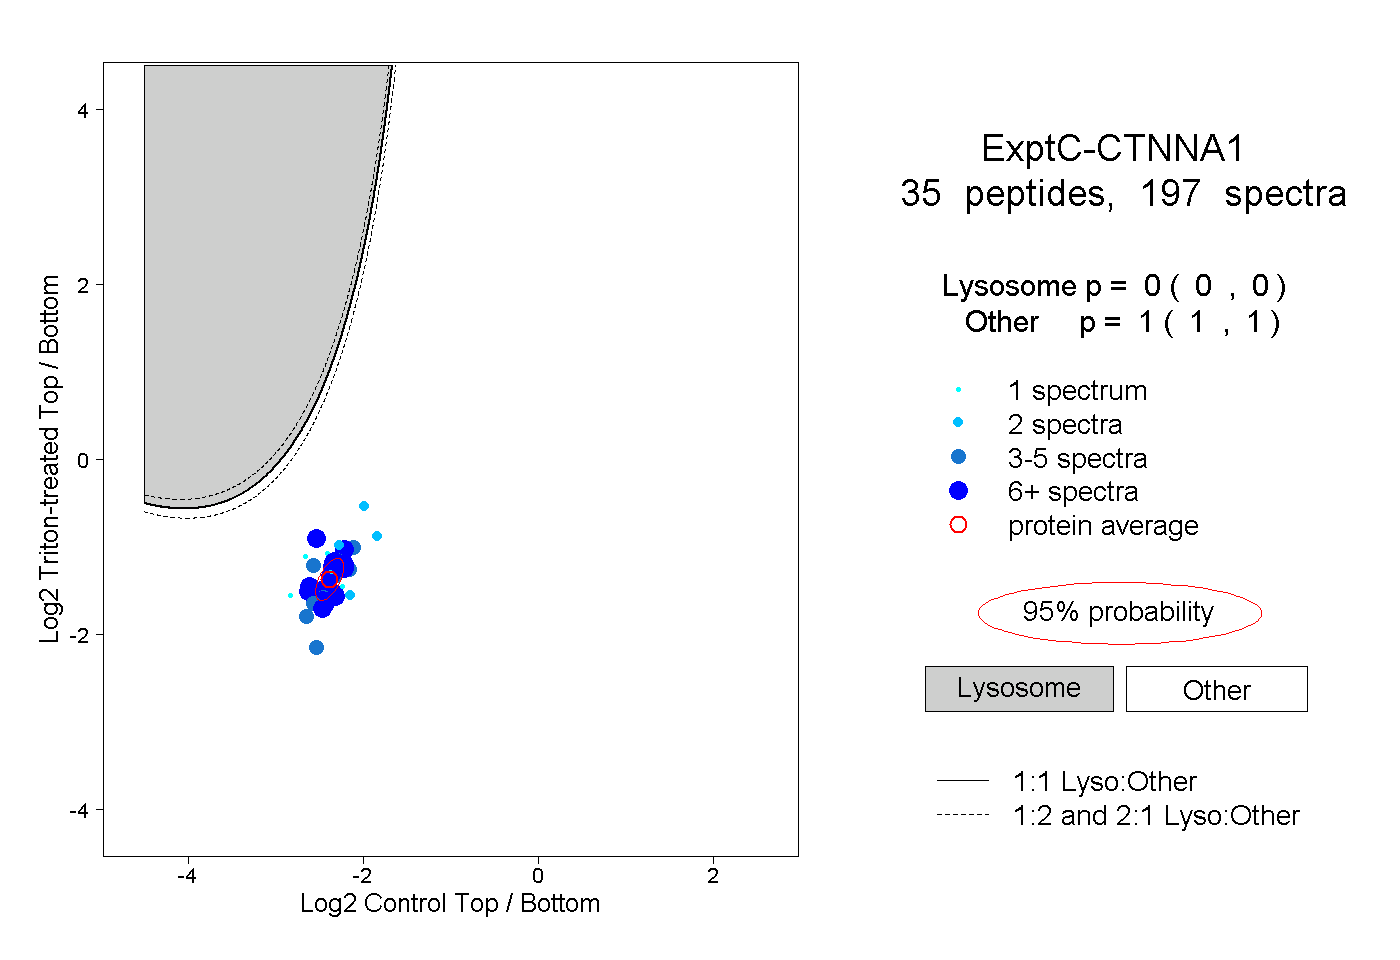
0.000 | 0.000
1.000 | 1.000
13peptides
spectra
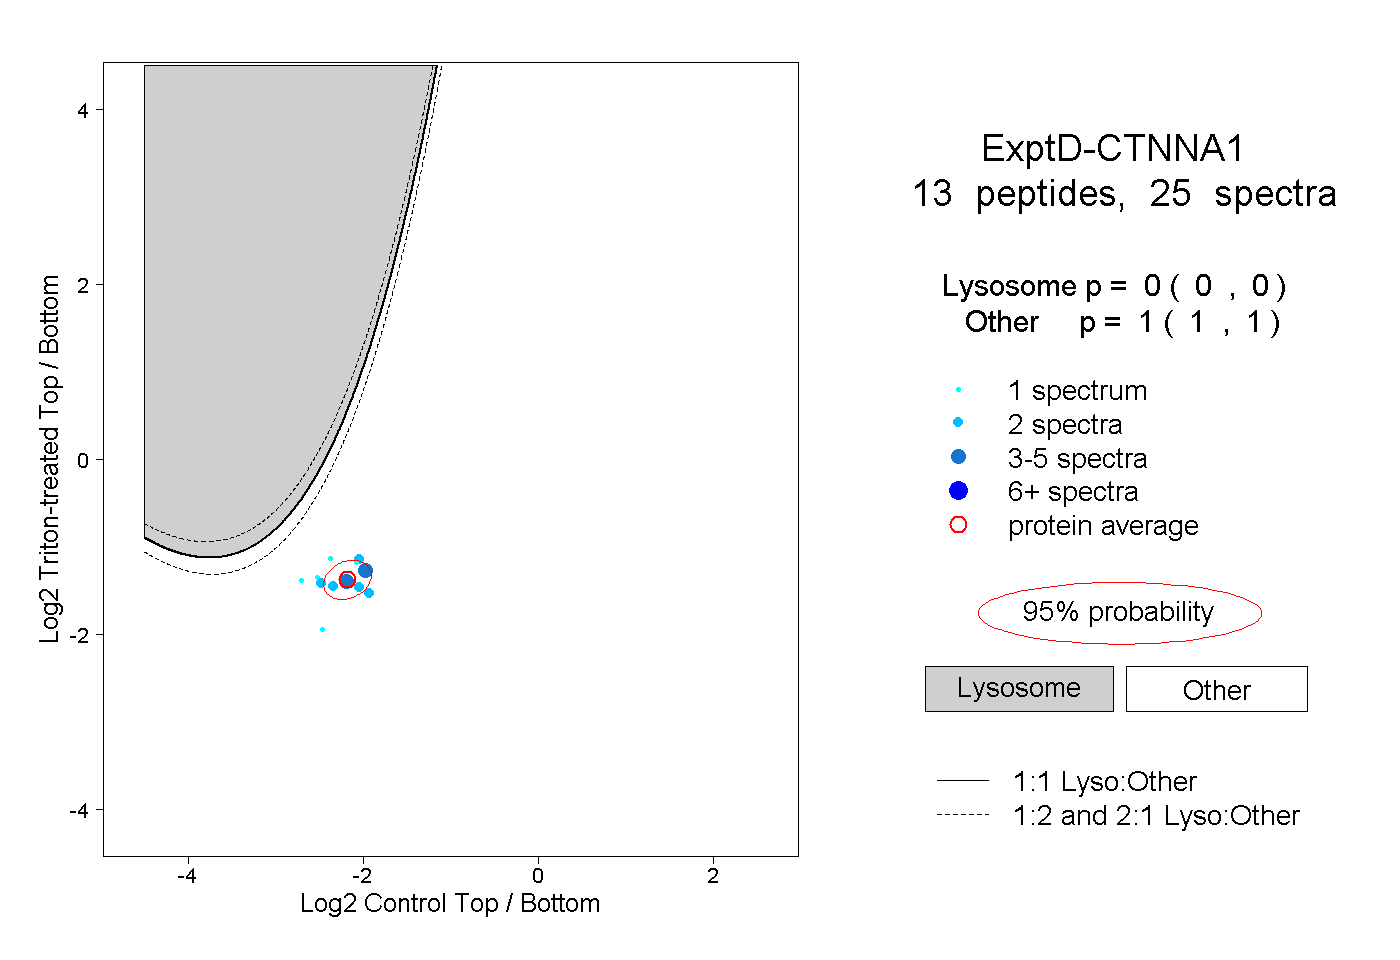
0.000 | 0.000
1.000 | 1.000