 8
8peptides
spectra
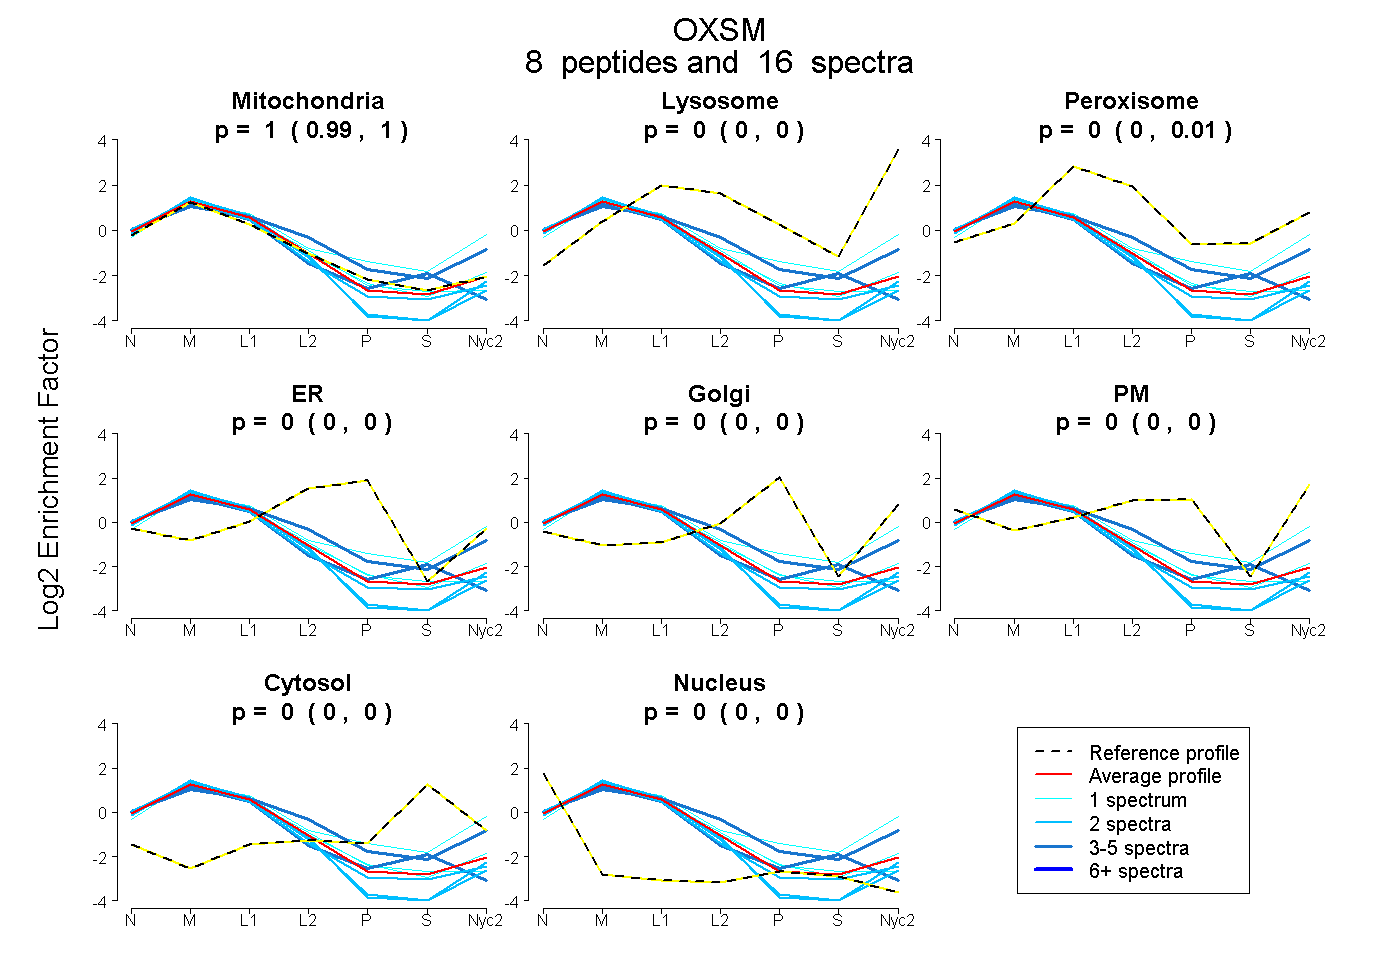
0.990 | 1.000
0.000 | 0.000
0.000 | 0.006
0.000 | 0.000
0.000 | 0.000
0.000 | 0.000
0.000 | 0.000
0.000 | 0.000
5peptides
spectra
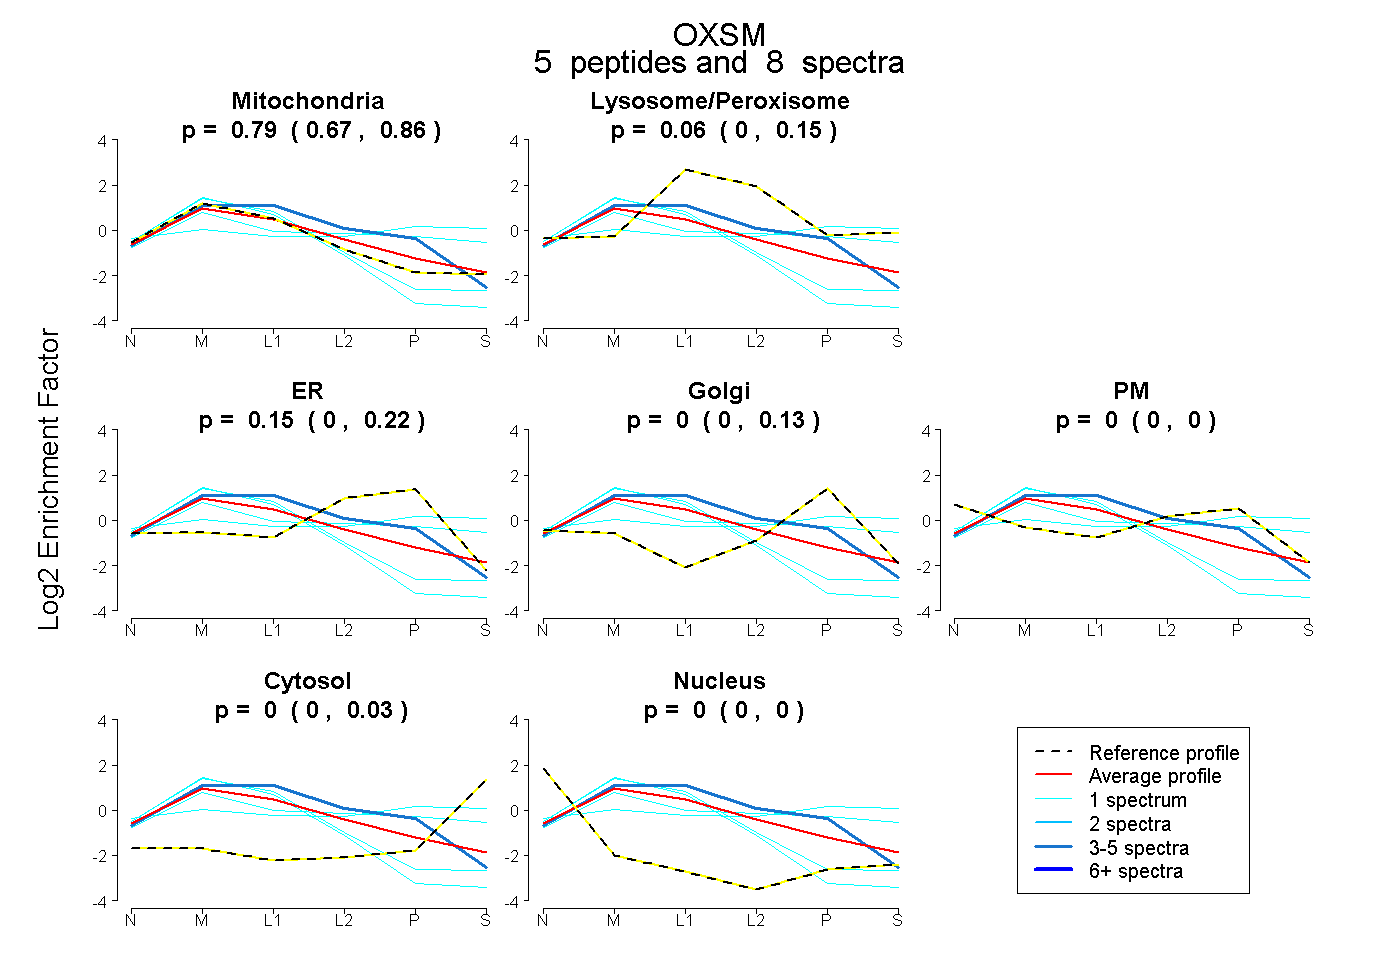
0.668 | 0.857
0.000 | 0.147
0.000 | 0.219
0.000 | 0.126
0.000 | 0.000
0.000 | 0.035
0.000 | 0.000
12peptides
spectra
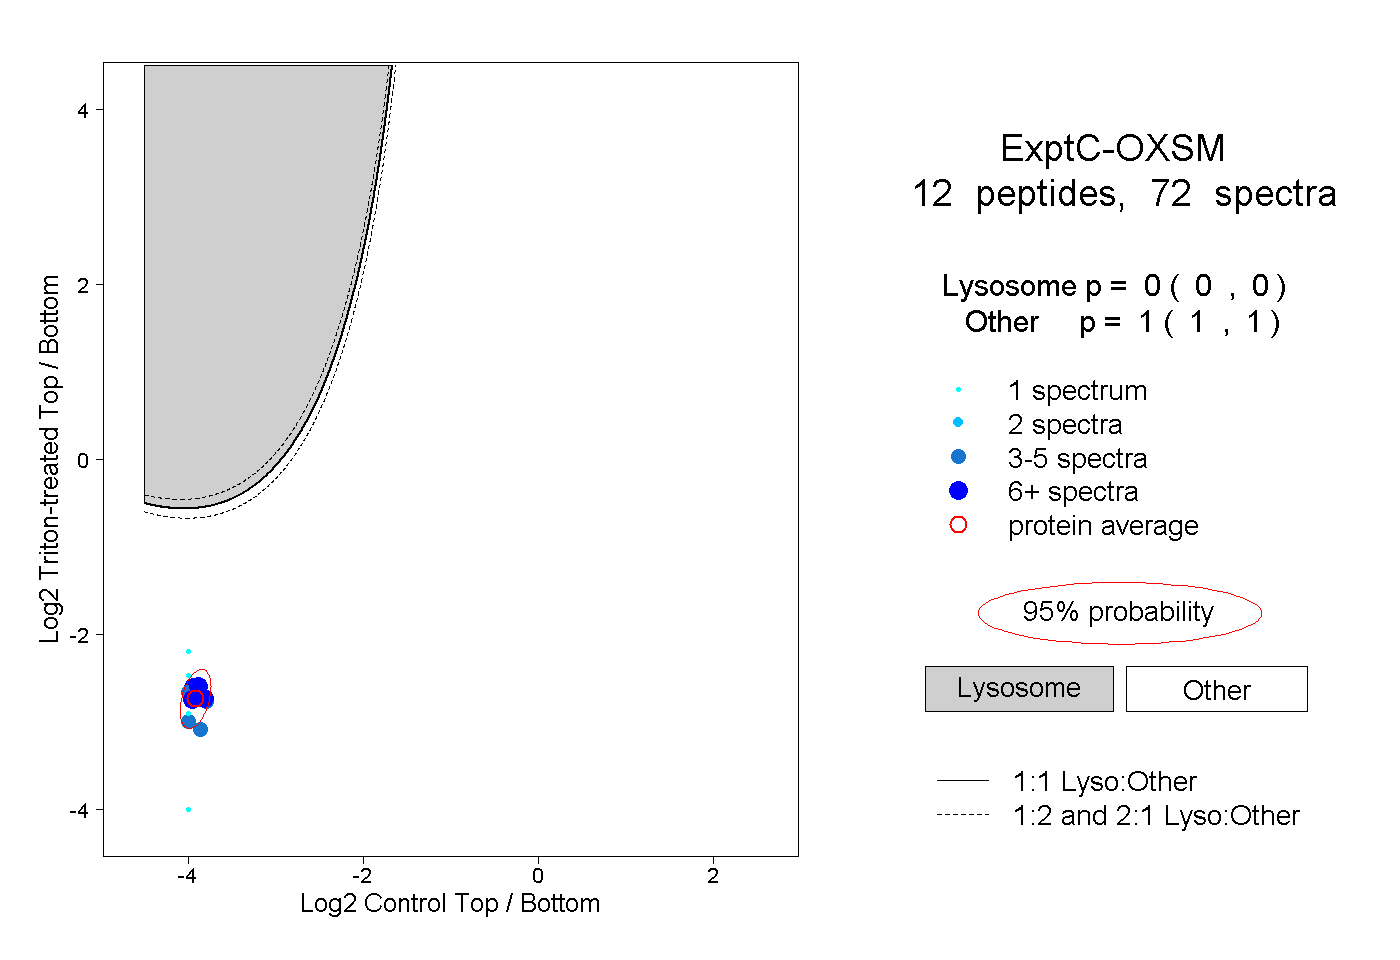
0.000 | 0.000
1.000 | 1.000
3peptides
spectra
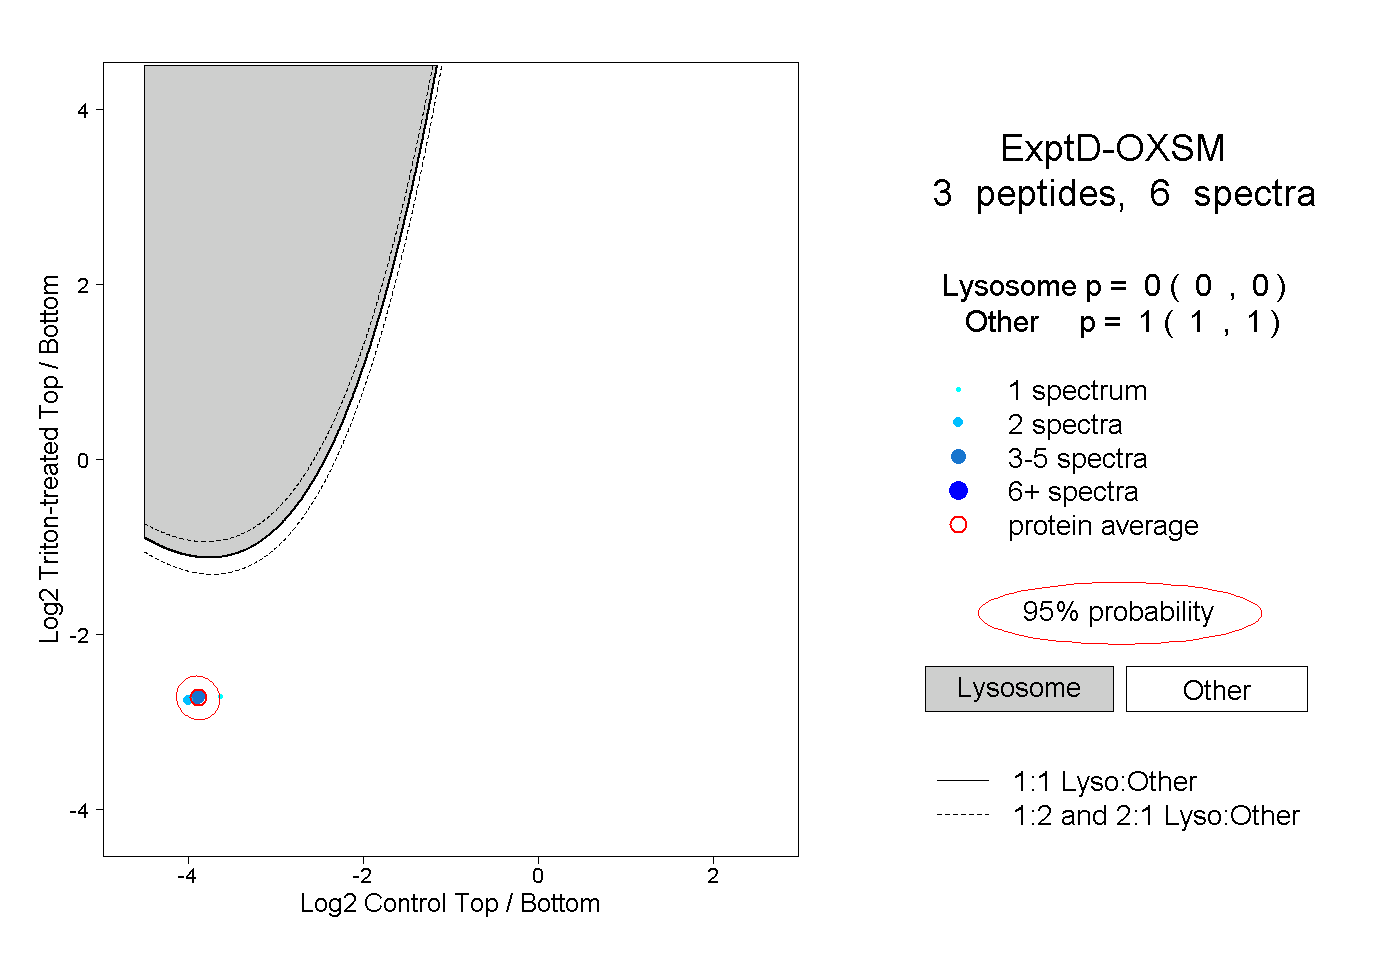
0.000 | 0.000
1.000 | 1.000