 8
8peptides
spectra
0.990 | 1.000
0.000 | 0.000
0.000 | 0.006
0.000 | 0.000
0.000 | 0.000
0.000 | 0.000
0.000 | 0.000
0.000 | 0.000
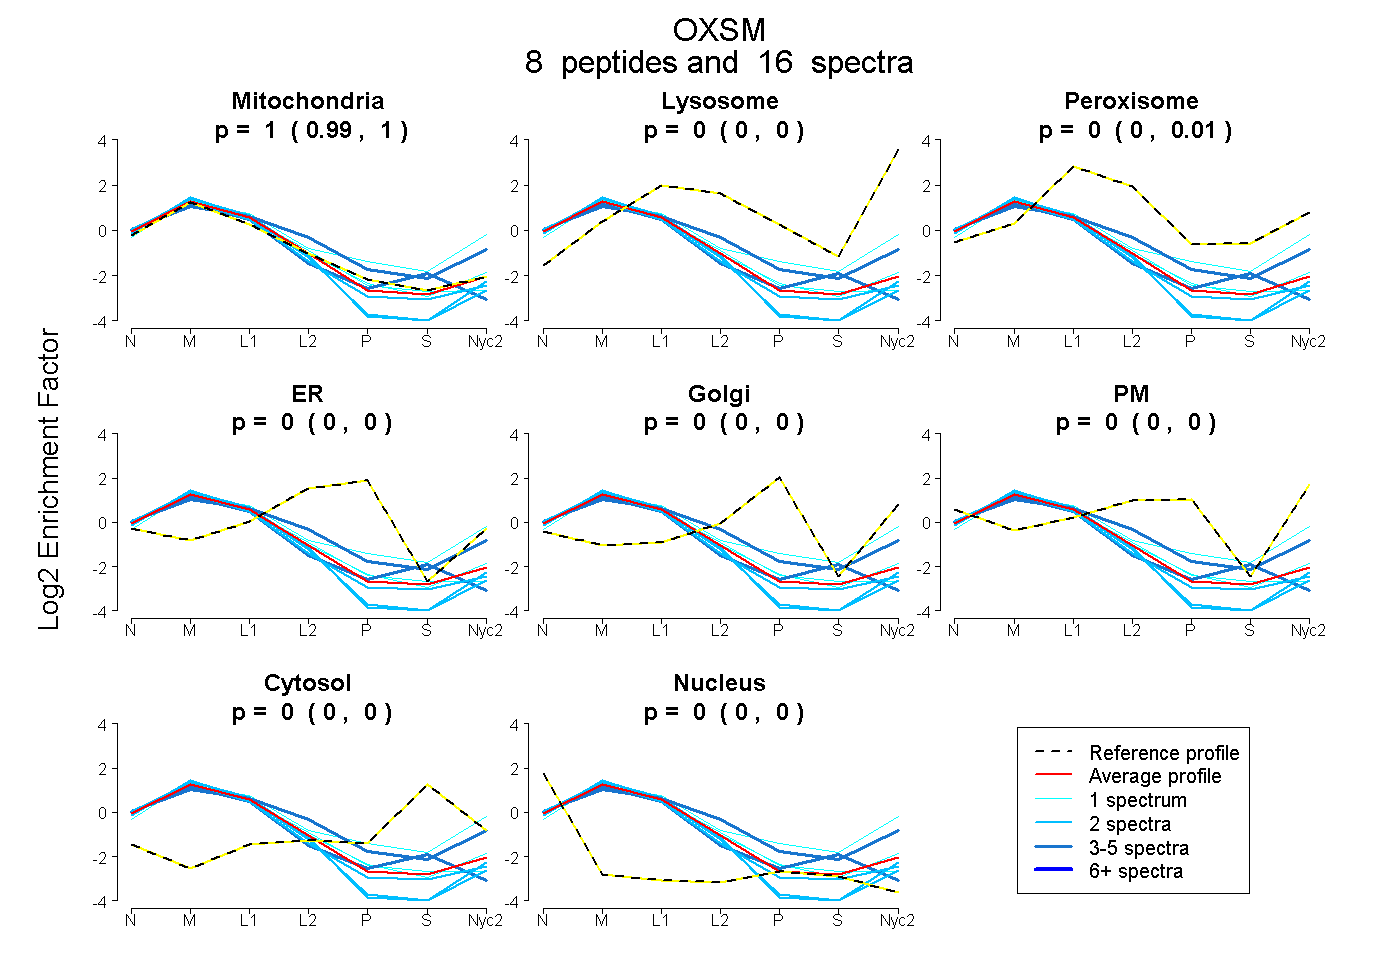
| Plot | Mito | Lyso | Perox | ER | Golgi | PM | Cytosol | Nucleus | |||||
| Expt A |
8 peptides |
16 spectra |
|
1.000 0.990 | 1.000 |
0.000 0.000 | 0.000 |
0.000 0.000 | 0.006 |
0.000 0.000 | 0.000 |
0.000 0.000 | 0.000 |
0.000 0.000 | 0.000 |
0.000 0.000 | 0.000 |
0.000 0.000 | 0.000 |
| 2 spectra, SIPCSVAAFVPR | 0.982 | 0.000 | 0.000 | 0.000 | 0.000 | 0.000 | 0.000 | 0.018 | ||
| 4 spectra, GESGIVSVVGDEYK | 0.928 | 0.000 | 0.000 | 0.000 | 0.000 | 0.000 | 0.003 | 0.068 | ||
| 2 spectra, GQFNEQNFVSK | 0.994 | 0.000 | 0.000 | 0.000 | 0.000 | 0.000 | 0.000 | 0.006 | ||
| 1 spectrum, ALSTNPDPK | 0.989 | 0.008 | 0.004 | 0.000 | 0.000 | 0.000 | 0.000 | 0.000 | ||
| 2 spectra, VSPFFVPK | 0.961 | 0.000 | 0.000 | 0.000 | 0.000 | 0.000 | 0.000 | 0.039 | ||
| 1 spectrum, DSGWYPK | 0.652 | 0.250 | 0.013 | 0.000 | 0.000 | 0.045 | 0.014 | 0.026 | ||
| 3 spectra, SMSSPTIMAVGAAELALK | 0.705 | 0.053 | 0.144 | 0.000 | 0.000 | 0.090 | 0.000 | 0.008 | ||
| 1 spectrum, DGFVMGEGAAVLVLEEHEHAVQR | 1.000 | 0.000 | 0.000 | 0.000 | 0.000 | 0.000 | 0.000 | 0.000 |
| Plot | Mito | Lyso or Perox | ER | Golgi | PM | Cytosol | Nucleus | ||||||
| Expt B |
5 peptides |
8 spectra |
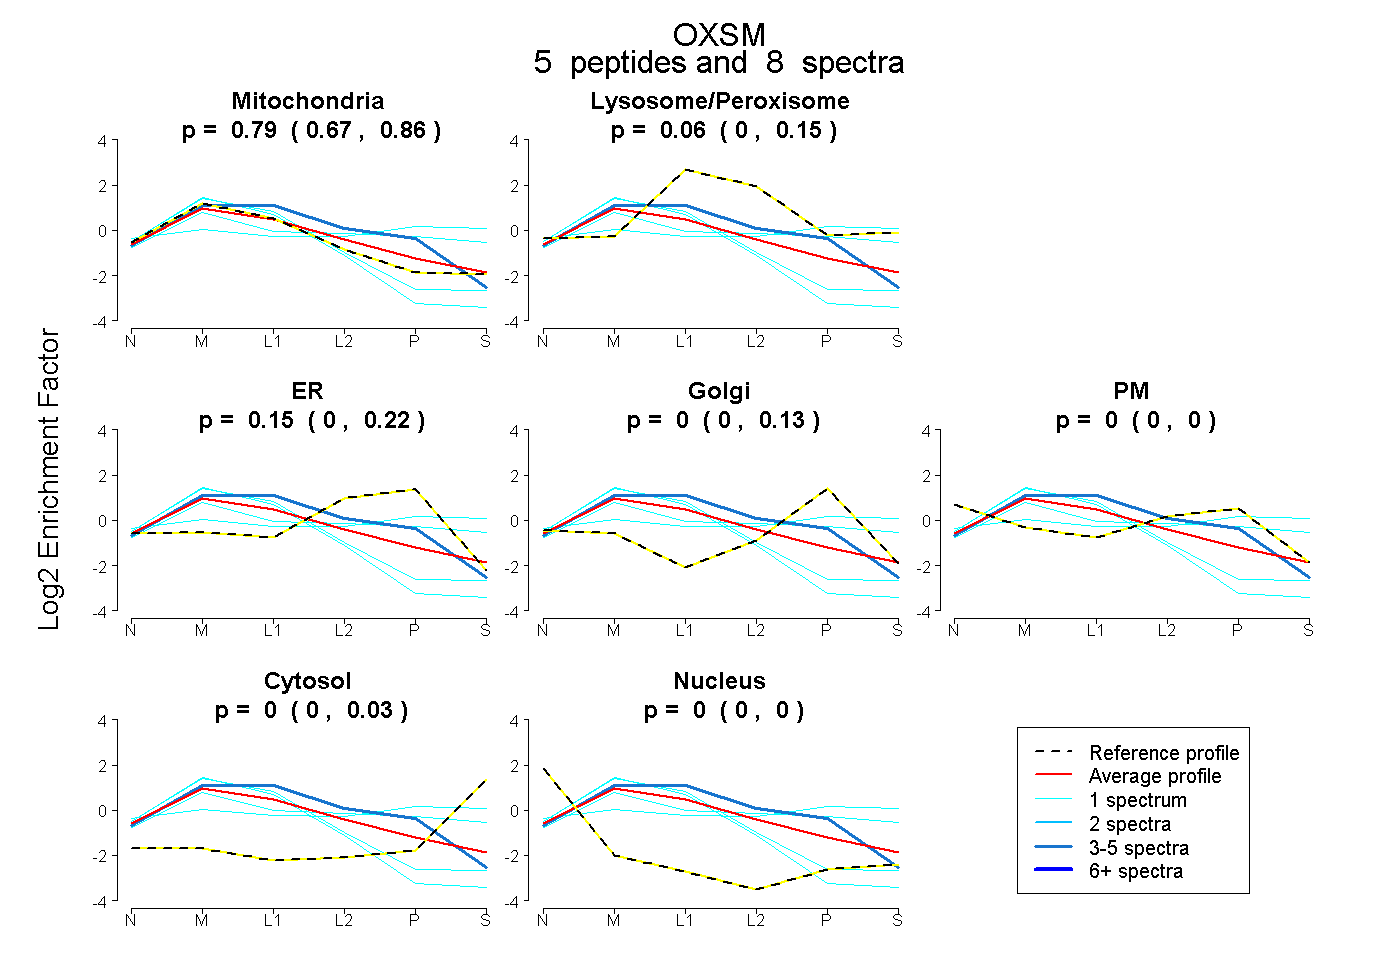 |
0.792 0.668 | 0.857 |
0.055 0.000 | 0.147 |
0.152 0.000 | 0.219 |
0.000 0.000 | 0.126 |
0.000 0.000 | 0.000 |
0.000 0.000 | 0.035 |
0.000 0.000 | 0.000 |
|||
| Plot | Lyso | Other | |||||||||||
| Expt C |
12 peptides |
72 spectra |
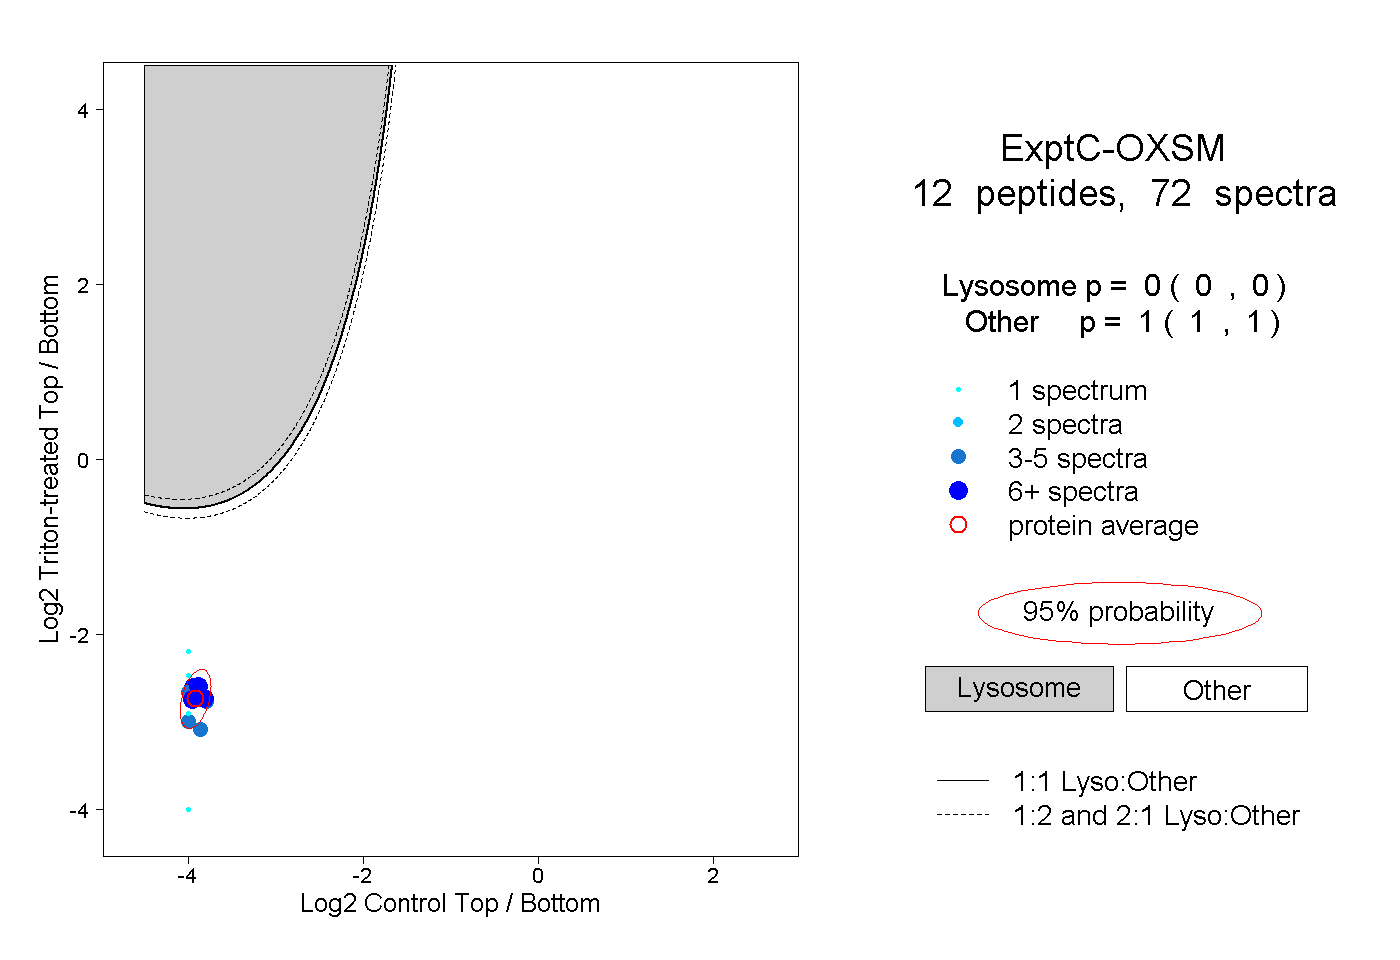 |
0.000 0.000 | 0.000 |
1.000 1.000 | 1.000 |
||||||||
| Plot | Lyso | Other | |||||||||||
| Expt D |
3 peptides |
6 spectra |
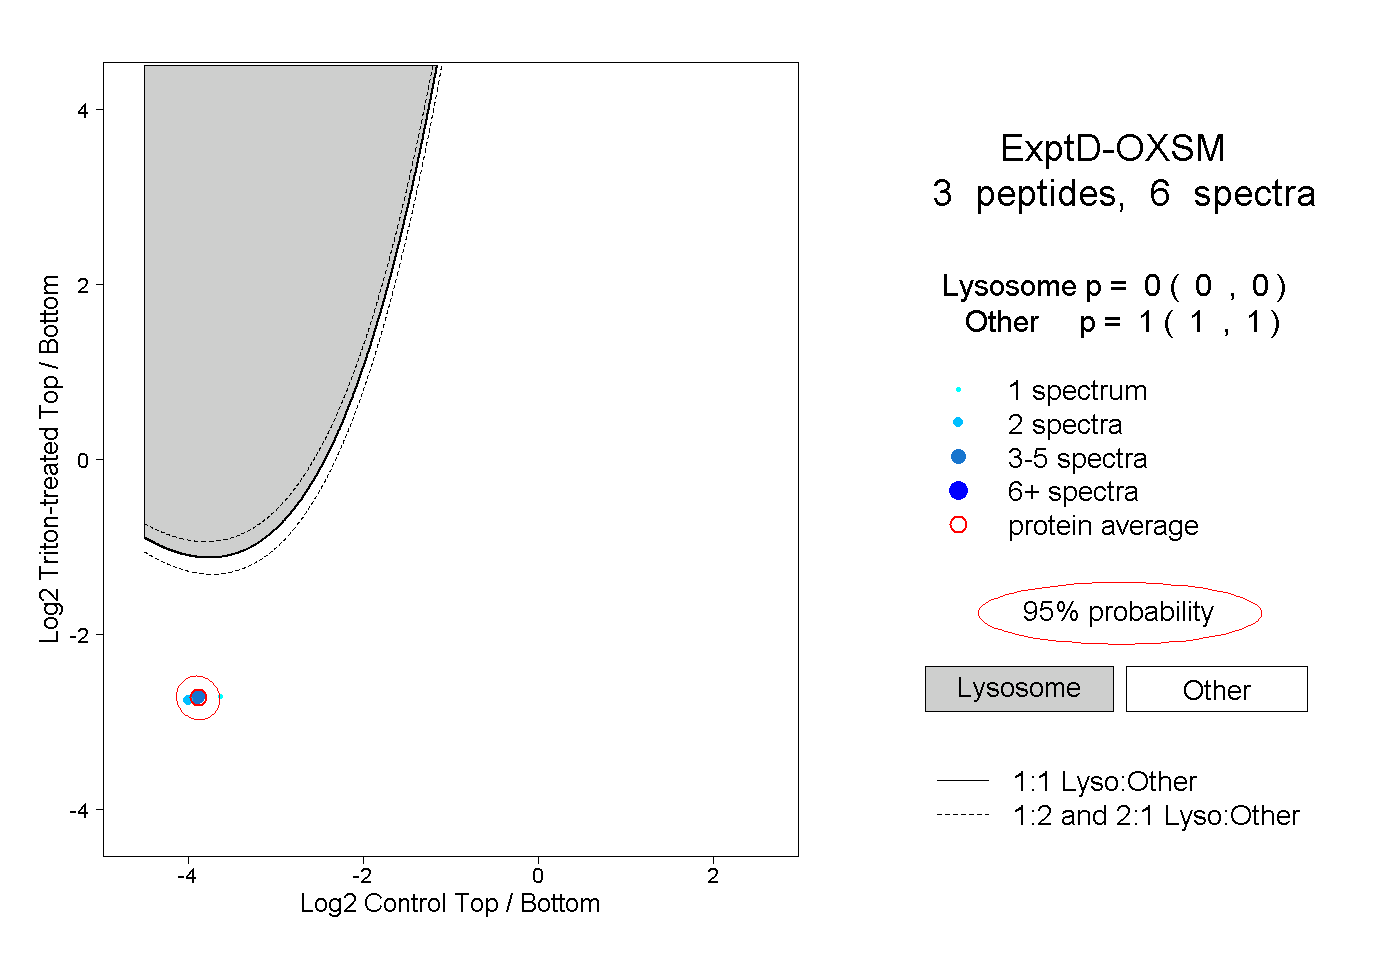 |
0.000 0.000 | 0.000 |
1.000 1.000 | 1.000 |