 4
4peptides
spectra
0.000 | 0.000
0.010 | 0.113
0.000 | 0.000
0.000 | 0.090
0.039 | 0.180
0.000 | 0.000
0.742 | 0.814
0.000 | 0.000
3peptides
spectra
0.000 | 0.000
1.000 | 1.000
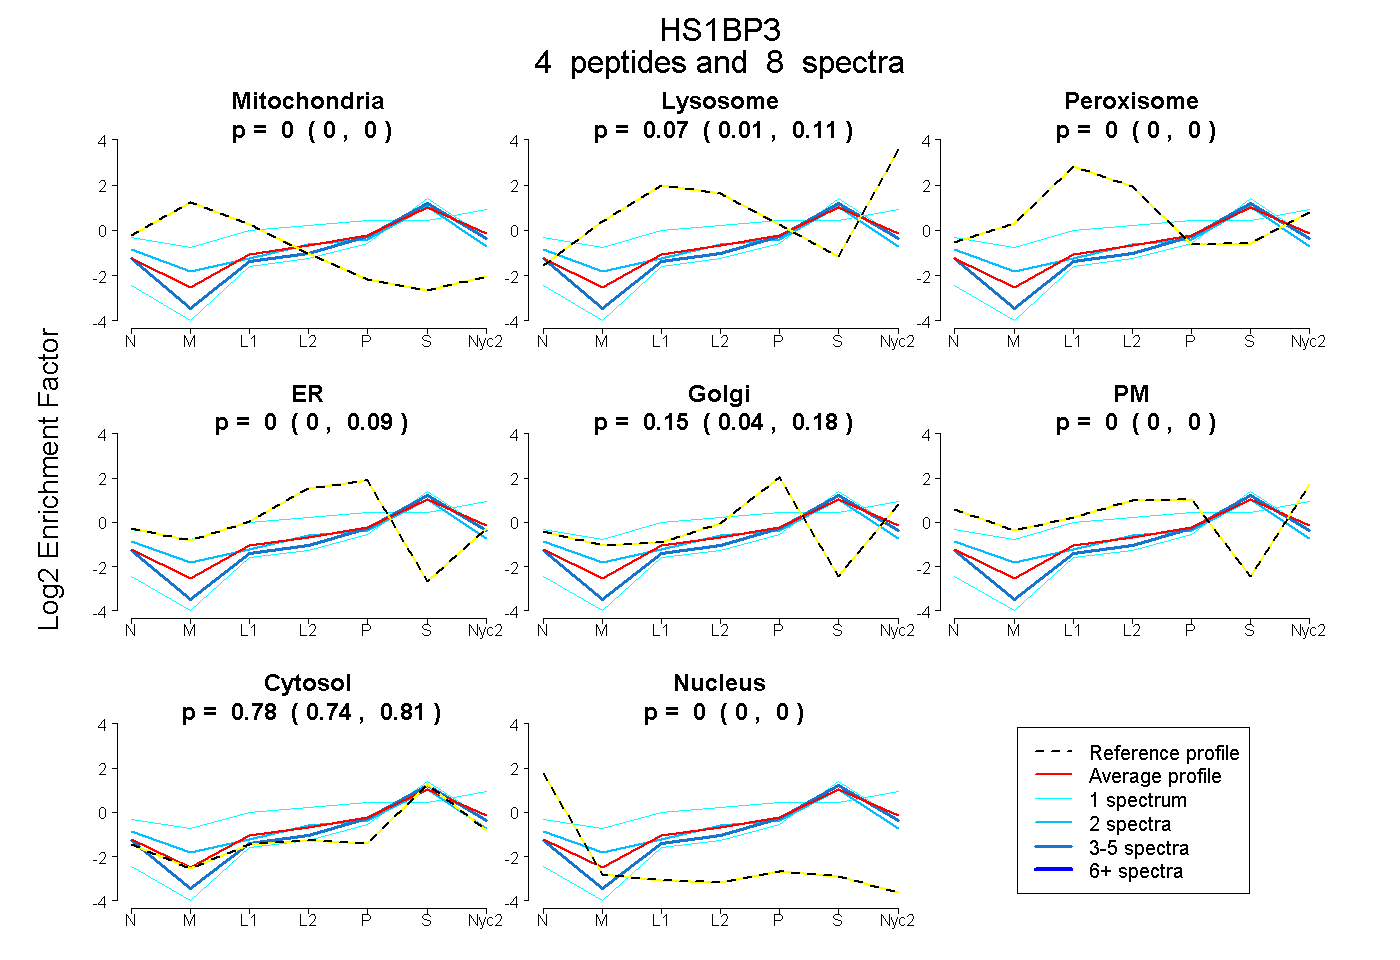
| Plot | Mito | Lyso | Perox | ER | Golgi | PM | Cytosol | Nucleus | |||||
| Expt A |
4 peptides |
8 spectra |
|
0.000 0.000 | 0.000 |
0.070 0.010 | 0.113 |
0.000 0.000 | 0.000 |
0.000 0.000 | 0.090 |
0.149 0.039 | 0.180 |
0.000 0.000 | 0.000 |
0.781 0.742 | 0.814 |
0.000 0.000 | 0.000 |
||
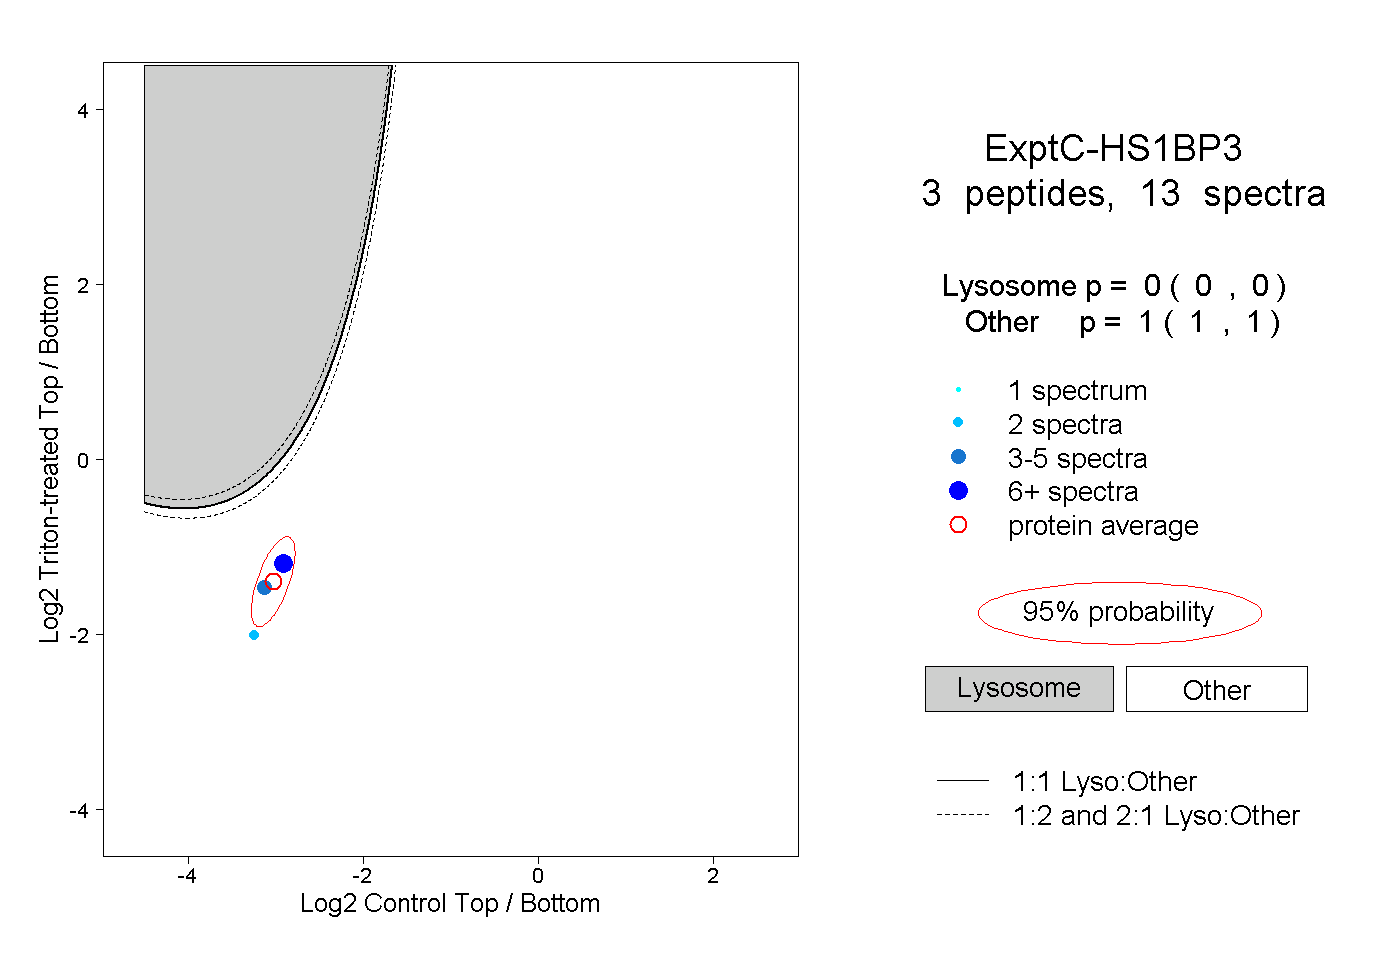
| Plot | Lyso | Other | |||||||||||
| Expt C |
3 peptides |
13 spectra |
|
0.000 0.000 | 0.000 |
1.000 1.000 | 1.000 |