 4
4peptides
spectra
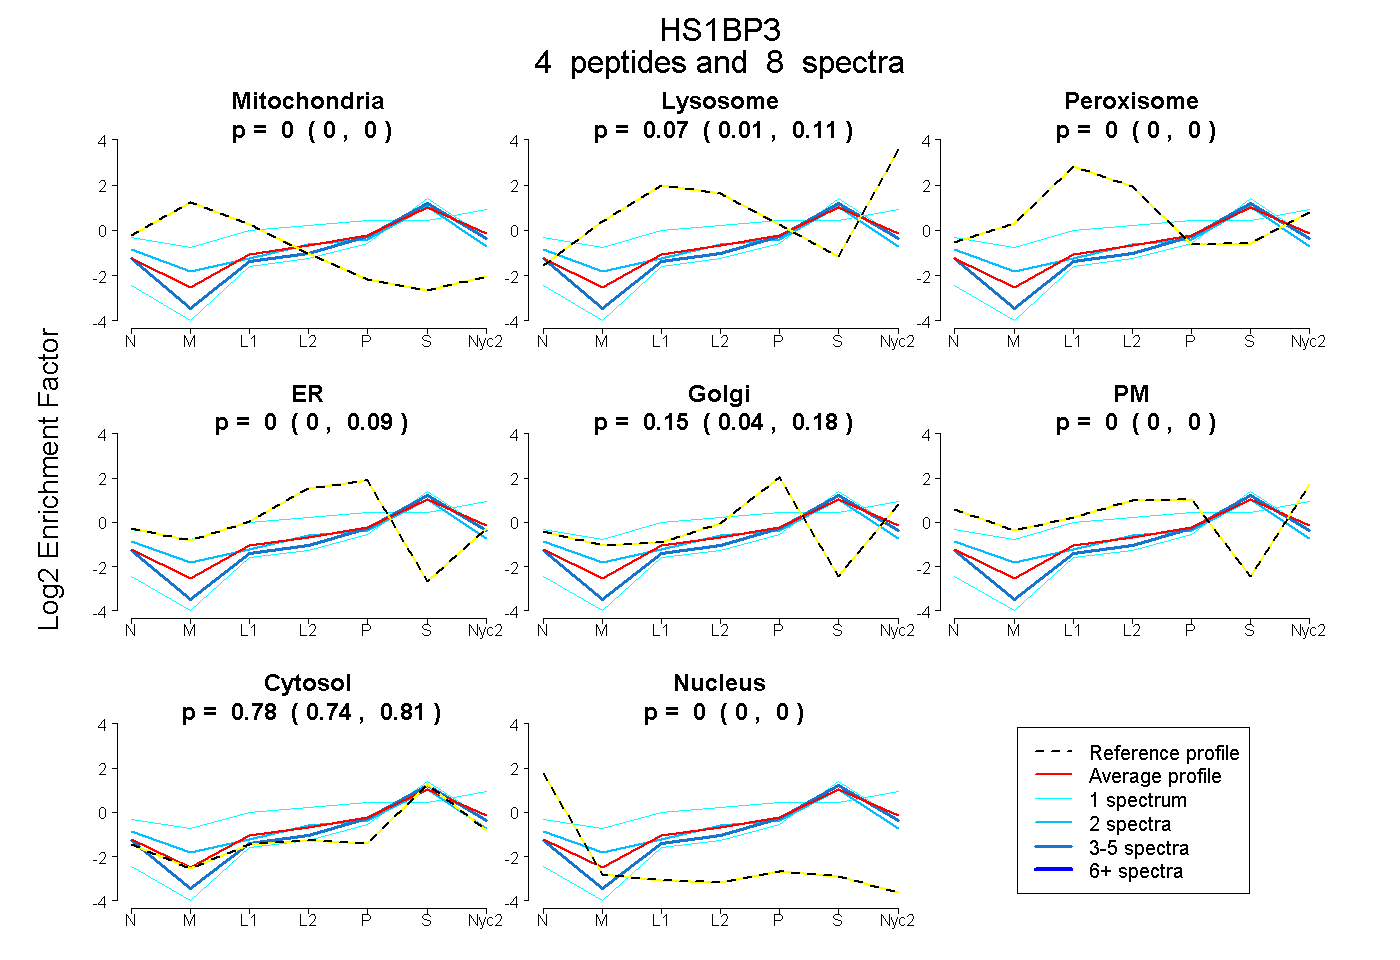
0.000 | 0.000
0.010 | 0.113
0.000 | 0.000
0.000 | 0.090
0.039 | 0.180
0.000 | 0.000
0.742 | 0.814
0.000 | 0.000
| Plot | Mito | Lyso | Perox | ER | Golgi | PM | Cytosol | Nucleus | |||||
| Expt A |
4 peptides |
8 spectra |
|
0.000 0.000 | 0.000 |
0.070 0.010 | 0.113 |
0.000 0.000 | 0.000 |
0.000 0.000 | 0.090 |
0.149 0.039 | 0.180 |
0.000 0.000 | 0.000 |
0.781 0.742 | 0.814 |
0.000 0.000 | 0.000 |
| 2 spectra, RPLGTTEDPLK | 0.000 | 0.000 | 0.026 | 0.158 | 0.015 | 0.012 | 0.788 | 0.000 | ||
| 1 spectrum, QVQNAHTGLDLTVPQHQEVR | 0.000 | 0.176 | 0.108 | 0.000 | 0.051 | 0.252 | 0.413 | 0.000 | ||
| 4 spectra, SPGATGFATR | 0.000 | 0.000 | 0.000 | 0.000 | 0.119 | 0.000 | 0.881 | 0.000 | ||
| 1 spectrum, DAQLAGSPELLEFLGTR | 0.000 | 0.000 | 0.000 | 0.000 | 0.000 | 0.000 | 1.000 | 0.000 |
| Plot | Lyso | Other | |||||||||||
| Expt C |
3 peptides |
13 spectra |
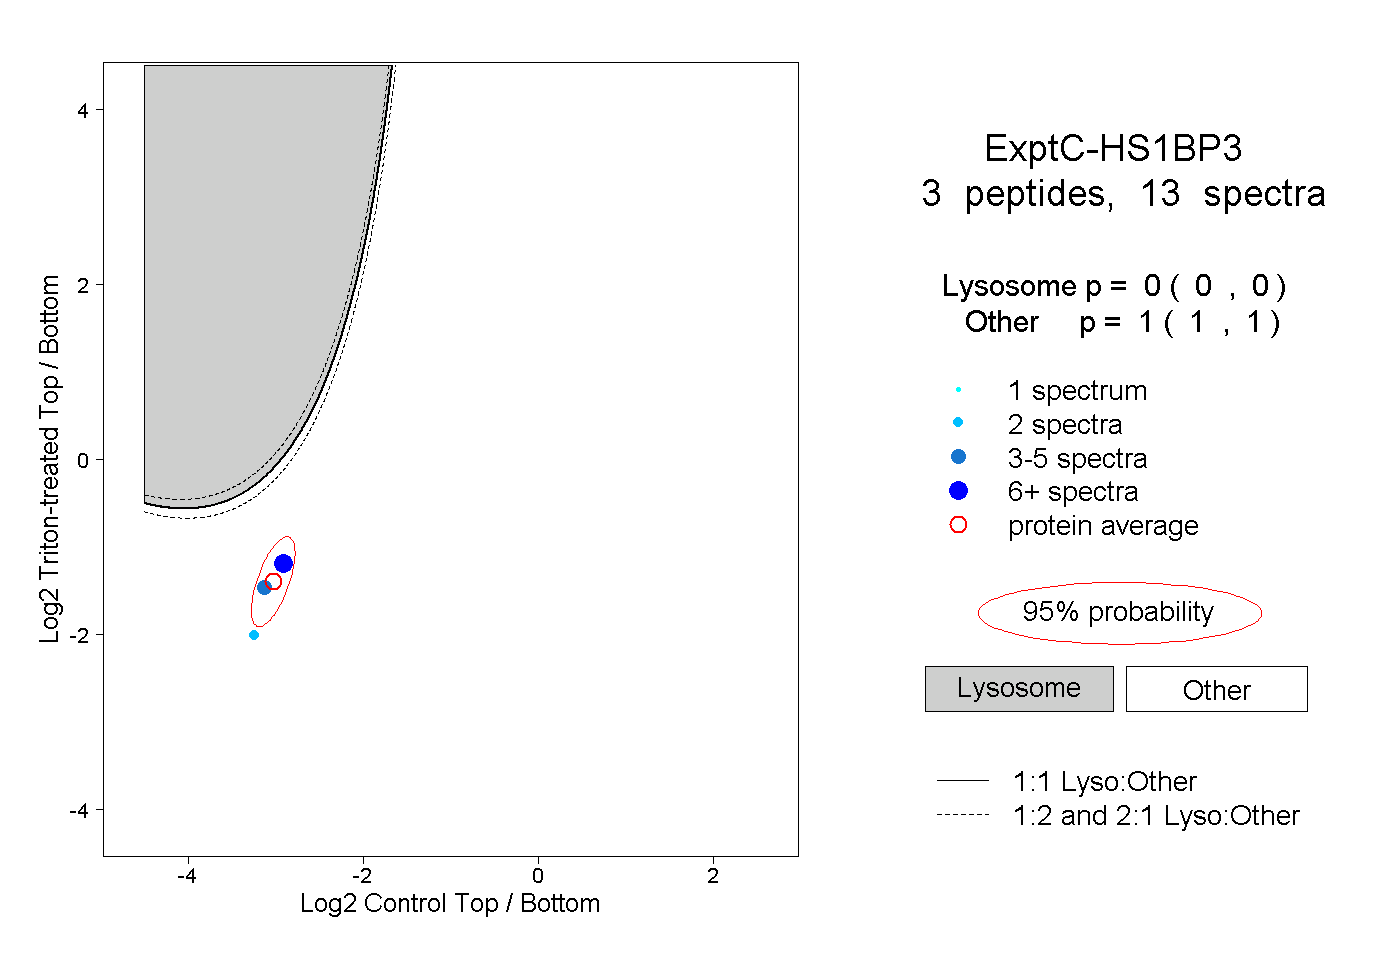 |
0.000 0.000 | 0.000 |
1.000 1.000 | 1.000 |