 4
4peptides
spectra
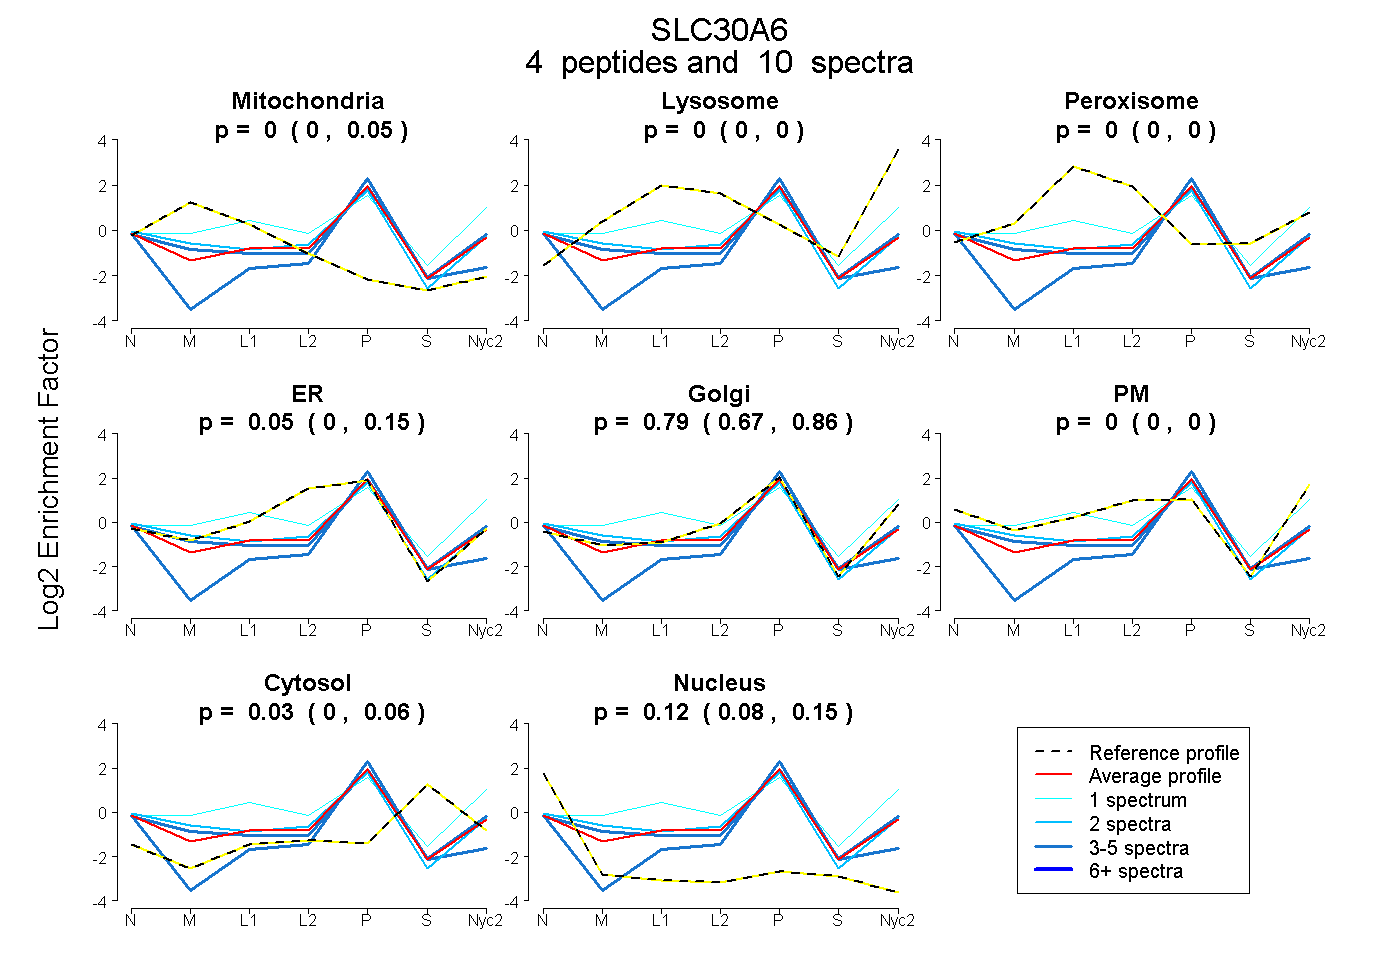
0.000 | 0.054
0.000 | 0.000
0.000 | 0.000
0.000 | 0.145
0.666 | 0.861
0.000 | 0.000
0.000 | 0.062
0.078 | 0.150
2peptides
spectra
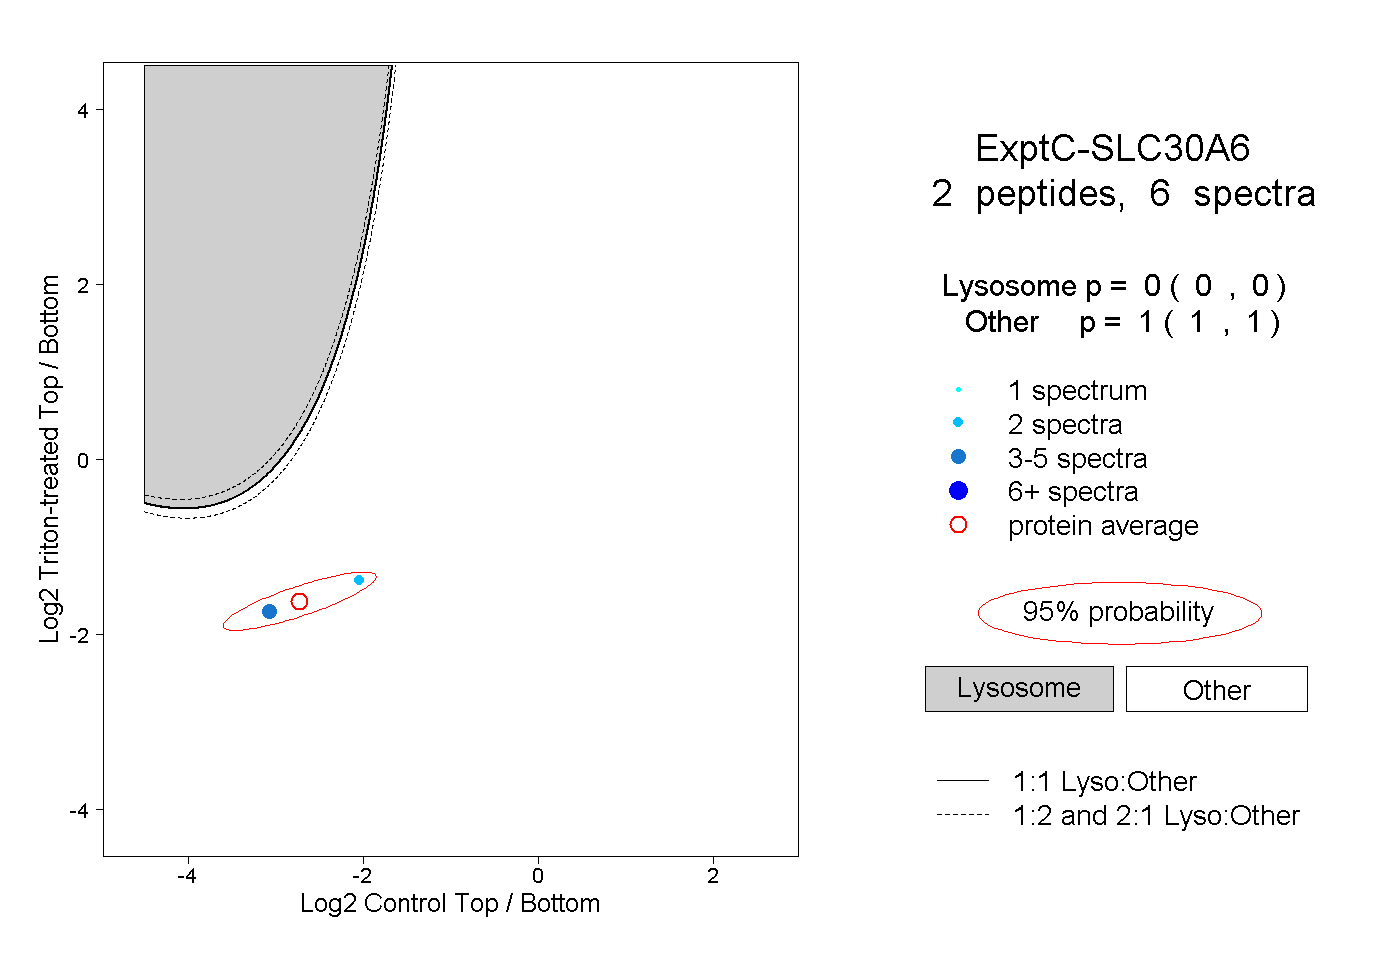
0.000 | 0.000
1.000 | 1.000
| Plot | Mito | Lyso | Perox | ER | Golgi | PM | Cytosol | Nucleus | |||||
| Expt A |
4 peptides |
10 spectra |
|
0.000 0.000 | 0.054 |
0.000 0.000 | 0.000 |
0.000 0.000 | 0.000 |
0.051 0.000 | 0.145 |
0.792 0.666 | 0.861 |
0.000 0.000 | 0.000 |
0.034 0.000 | 0.062 |
0.123 0.078 | 0.150 |
||
| Plot | Lyso | Other | |||||||||||
| Expt C |
2 peptides |
6 spectra |
|
0.000 0.000 | 0.000 |
1.000 1.000 | 1.000 |