 4
4peptides
spectra
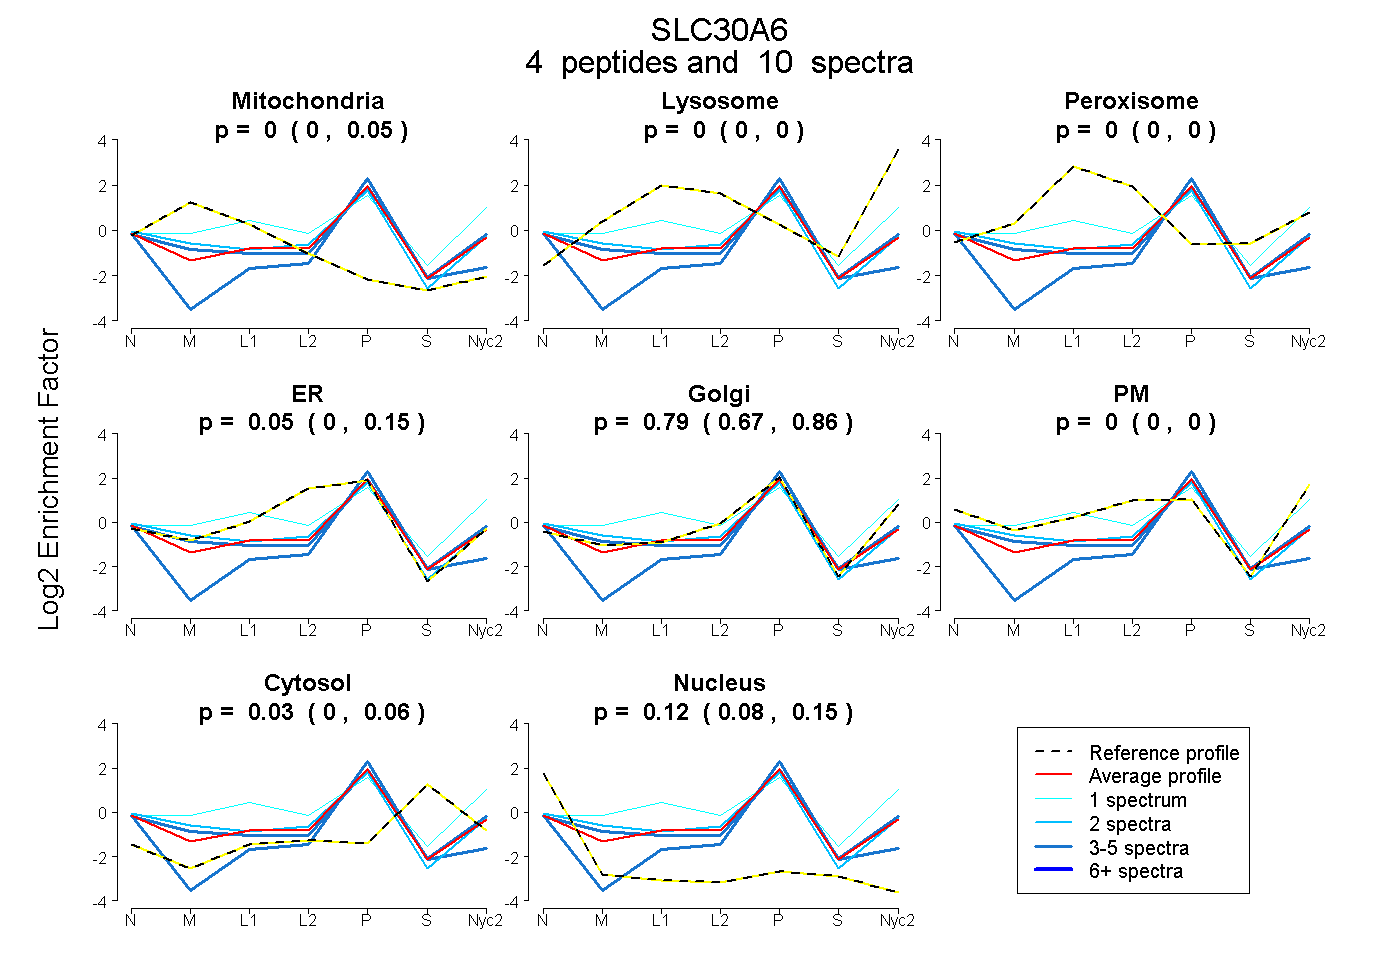
0.000 | 0.054
0.000 | 0.000
0.000 | 0.000
0.000 | 0.145
0.666 | 0.861
0.000 | 0.000
0.000 | 0.062
0.078 | 0.150
| Plot | Mito | Lyso | Perox | ER | Golgi | PM | Cytosol | Nucleus | |||||
| Expt A |
4 peptides |
10 spectra |
|
0.000 0.000 | 0.054 |
0.000 0.000 | 0.000 |
0.000 0.000 | 0.000 |
0.051 0.000 | 0.145 |
0.792 0.666 | 0.861 |
0.000 0.000 | 0.000 |
0.034 0.000 | 0.062 |
0.123 0.078 | 0.150 |
| 4 spectra, GTIHLFR | 0.000 | 0.000 | 0.000 | 0.000 | 0.651 | 0.000 | 0.053 | 0.296 | ||
| 3 spectra, EVSTLDGVLEVR | 0.030 | 0.000 | 0.000 | 0.000 | 0.840 | 0.000 | 0.023 | 0.106 | ||
| 1 spectrum, FLEQPEIHTGR | 0.030 | 0.070 | 0.218 | 0.000 | 0.661 | 0.021 | 0.000 | 0.000 | ||
| 2 spectra, LLQEFR | 0.105 | 0.000 | 0.000 | 0.050 | 0.770 | 0.000 | 0.000 | 0.075 |
| Plot | Lyso | Other | |||||||||||
| Expt C |
2 peptides |
6 spectra |
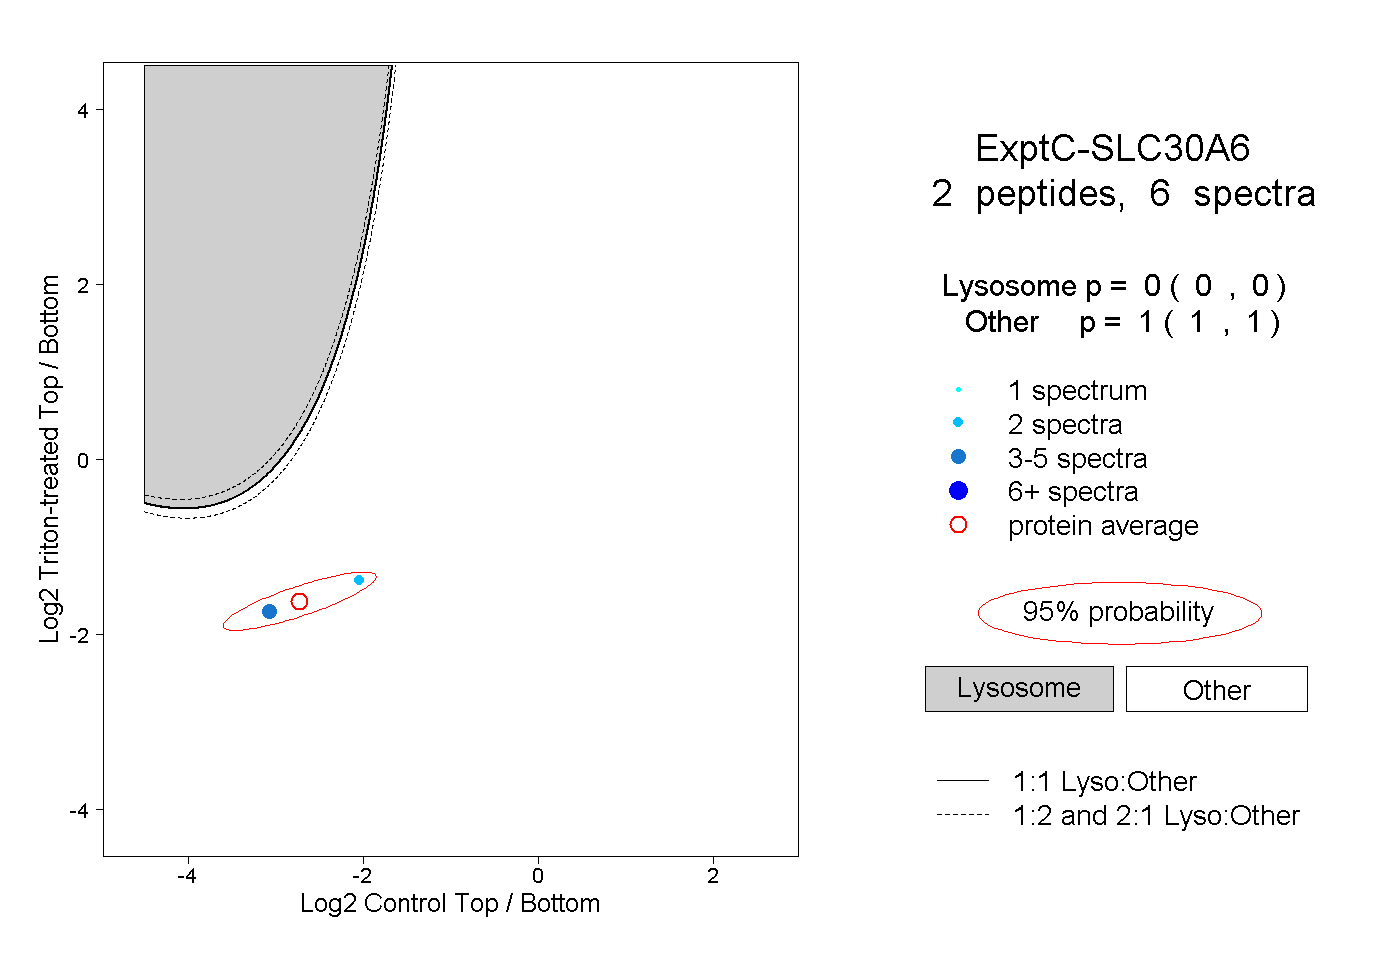 |
0.000 0.000 | 0.000 |
1.000 1.000 | 1.000 |