 5
5peptides
spectra
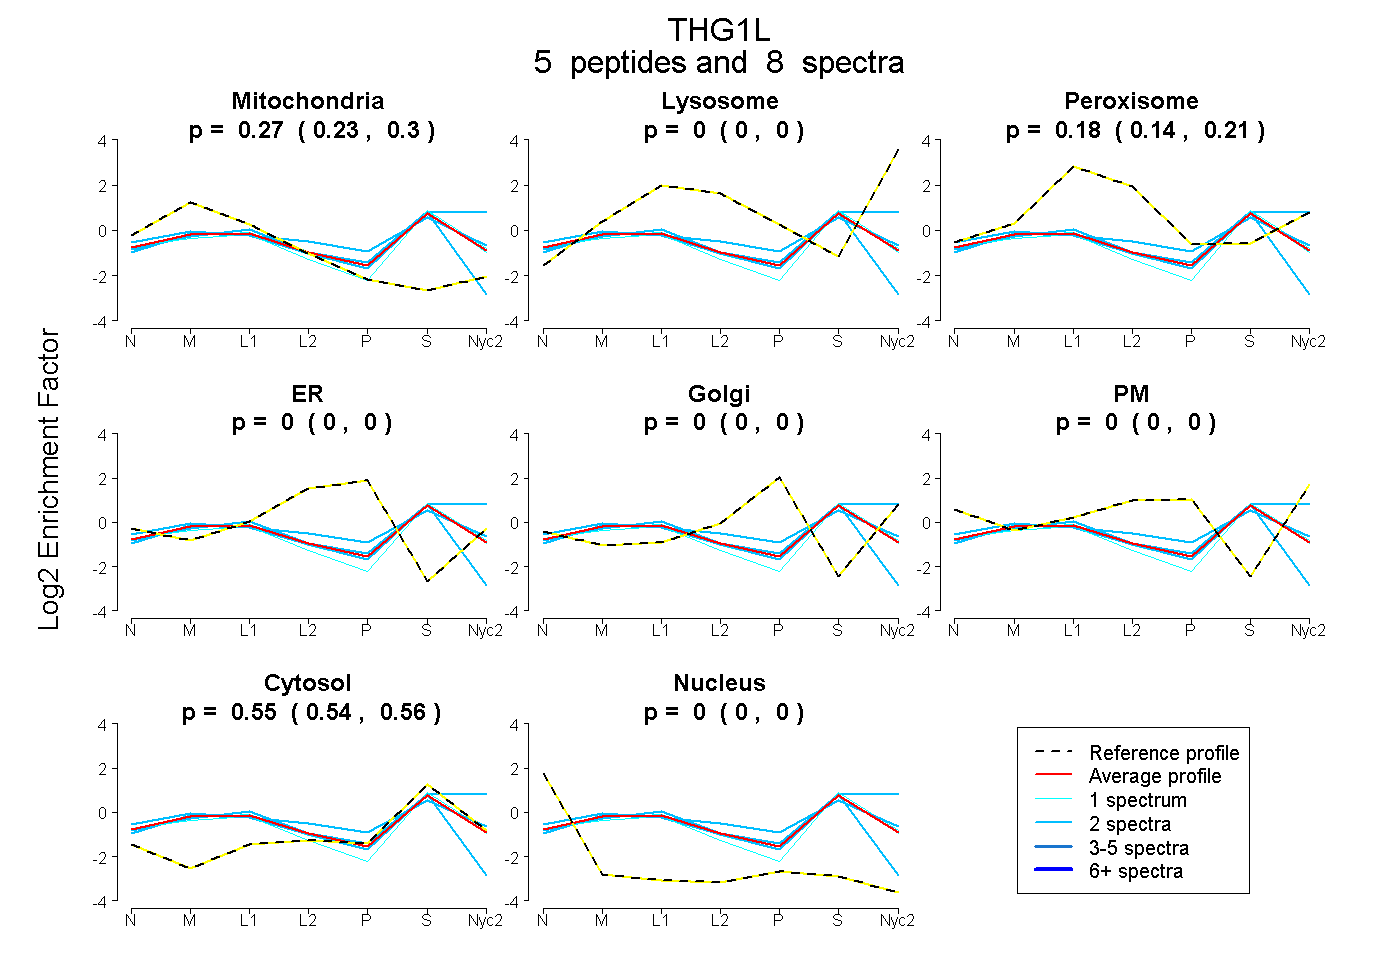
0.234 | 0.300
0.000 | 0.001
0.143 | 0.207
0.000 | 0.000
0.000 | 0.000
0.000 | 0.000
0.543 | 0.557
0.000 | 0.000
1peptide
spectrum
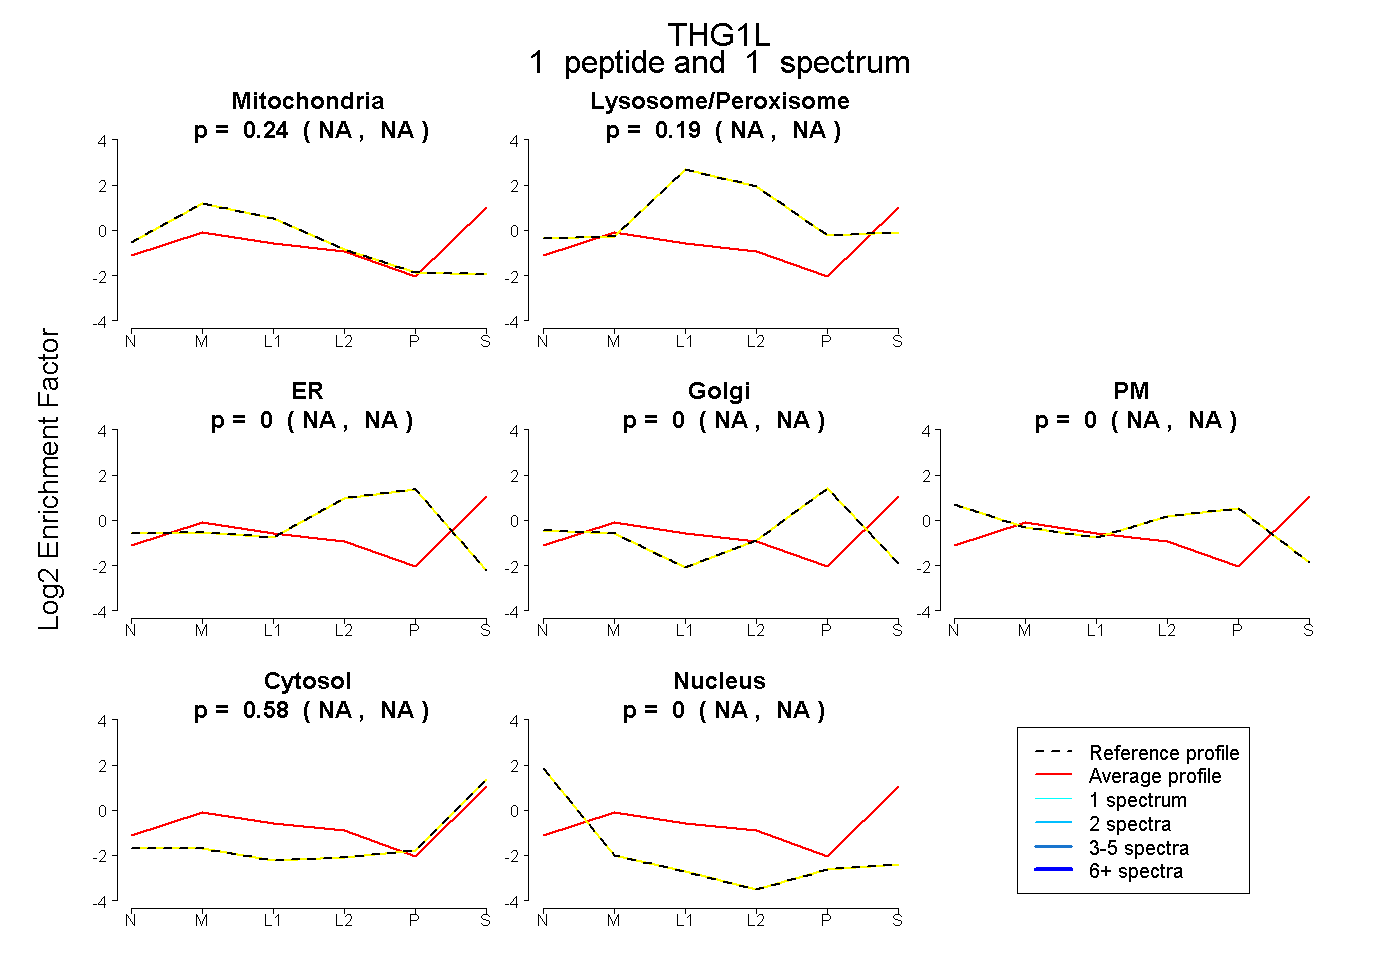
NA | NA
NA | NA
NA | NA
NA | NA
NA | NA
NA | NA
NA | NA
4peptides
spectra
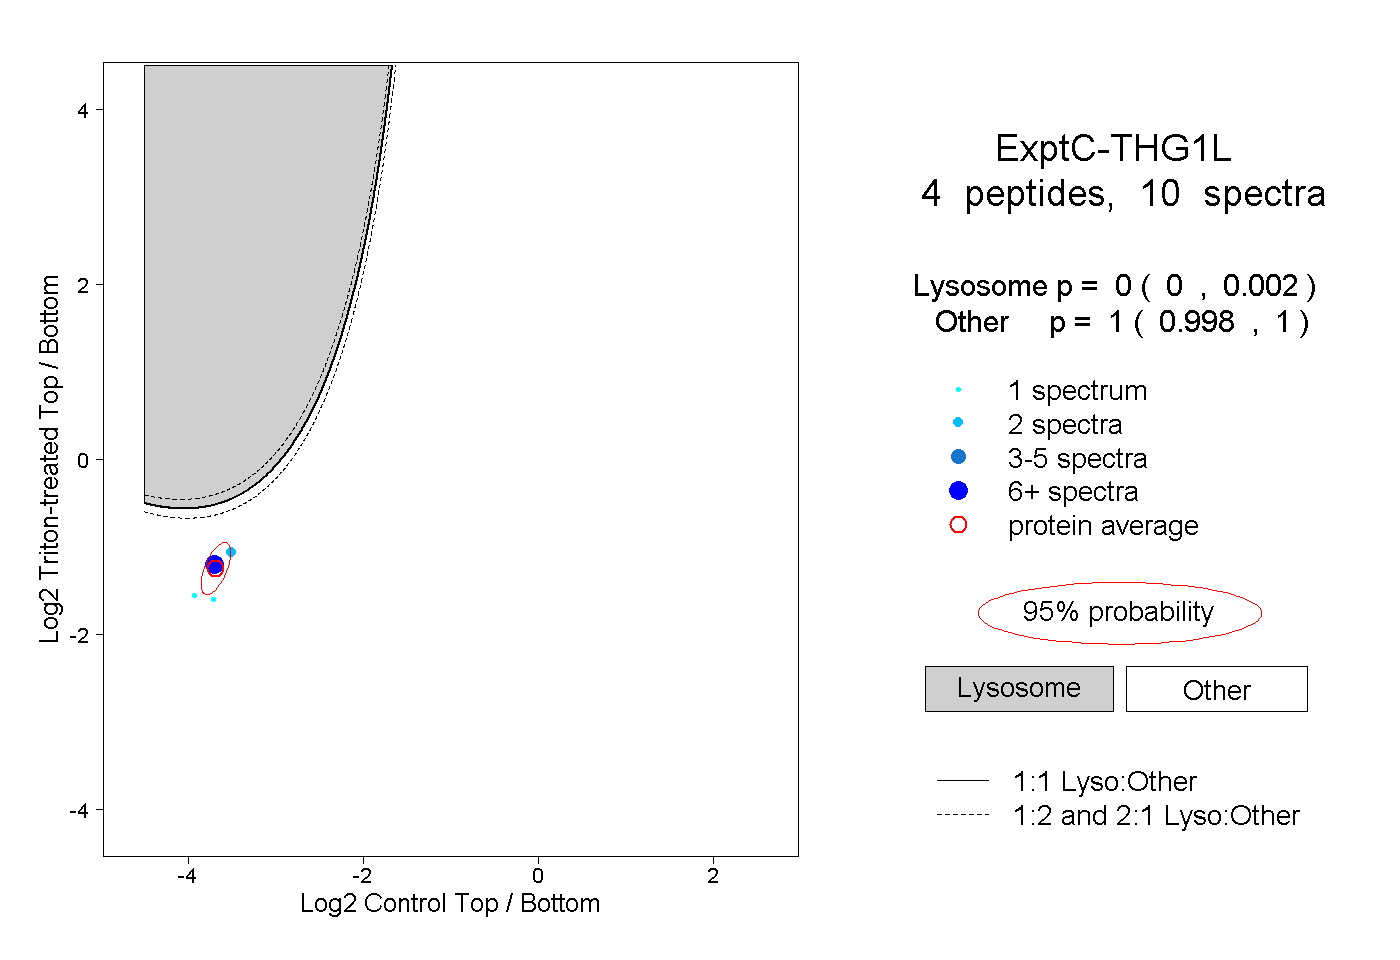
0.000 | 0.002
0.998 | 1.000