 5
5peptides
spectra
0.234 | 0.300
0.000 | 0.001
0.143 | 0.207
0.000 | 0.000
0.000 | 0.000
0.000 | 0.000
0.543 | 0.557
0.000 | 0.000
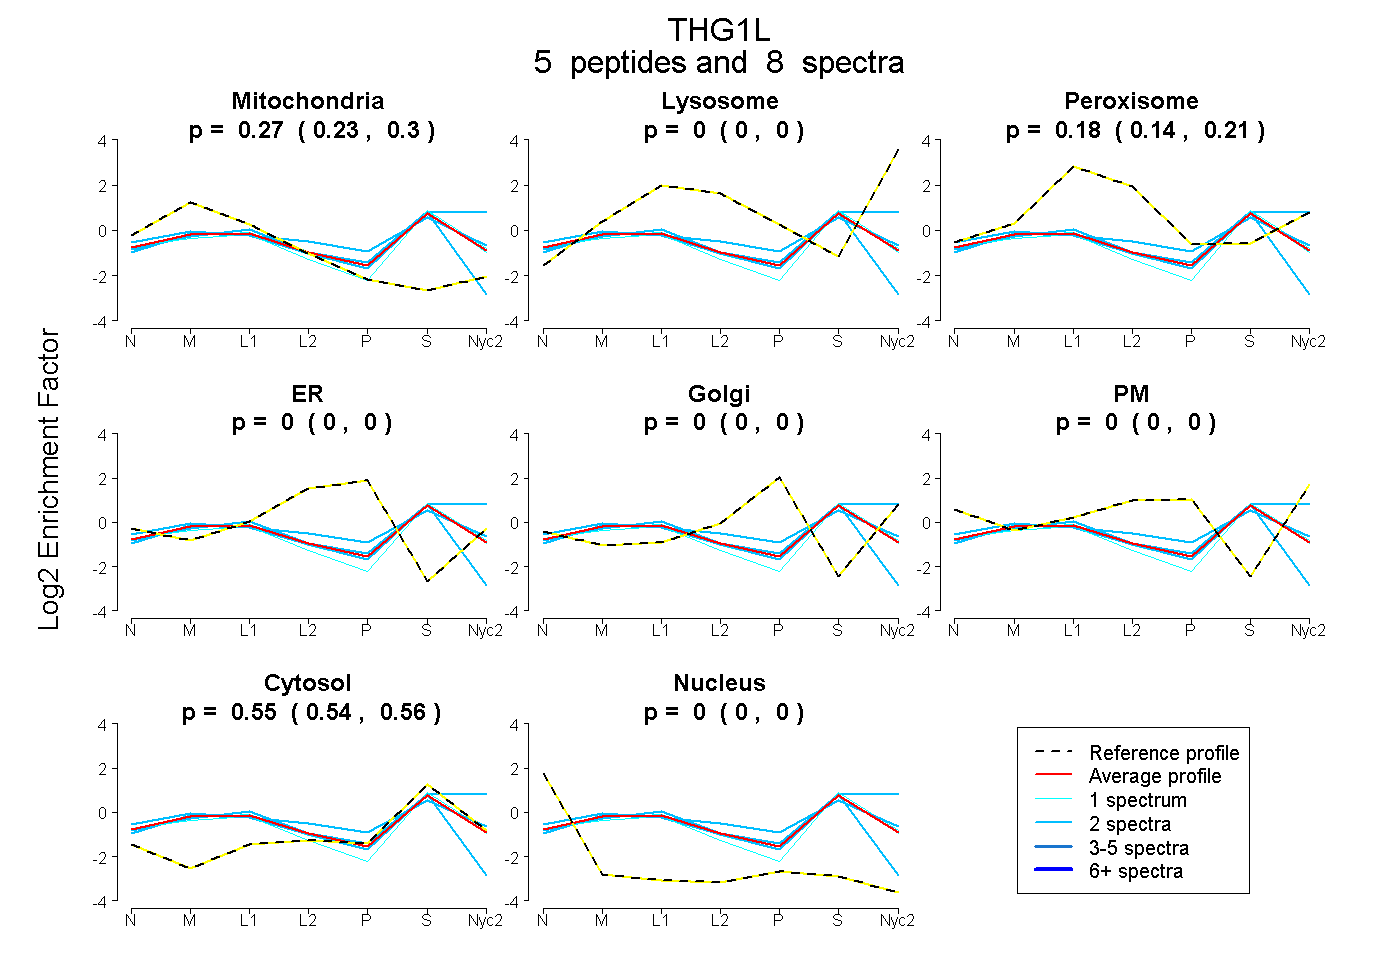
| Plot | Mito | Lyso | Perox | ER | Golgi | PM | Cytosol | Nucleus | |||||
| Expt A |
5 peptides |
8 spectra |
|
0.269 0.234 | 0.300 |
0.000 0.000 | 0.001 |
0.180 0.143 | 0.207 |
0.000 0.000 | 0.000 |
0.000 0.000 | 0.000 |
0.000 0.000 | 0.000 |
0.551 0.543 | 0.557 |
0.000 0.000 | 0.000 |
| 2 spectra, DYLSWR | 0.144 | 0.312 | 0.004 | 0.000 | 0.000 | 0.000 | 0.540 | 0.000 | ||
| 1 spectrum, ALHLMTK | 0.278 | 0.000 | 0.160 | 0.000 | 0.000 | 0.000 | 0.562 | 0.000 | ||
| 2 spectra, HNFAKPNDSR | 0.227 | 0.000 | 0.257 | 0.000 | 0.000 | 0.019 | 0.496 | 0.000 | ||
| 1 spectrum, EHPEILEGED | 0.292 | 0.000 | 0.117 | 0.000 | 0.000 | 0.000 | 0.591 | 0.000 | ||
| 2 spectra, DFEVDDTCLPHCWVVVR | 0.450 | 0.000 | 0.000 | 0.000 | 0.000 | 0.000 | 0.550 | 0.000 |
| Plot | Mito | Lyso or Perox | ER | Golgi | PM | Cytosol | Nucleus | ||||||
| Expt B |
1 peptide |
1 spectrum |
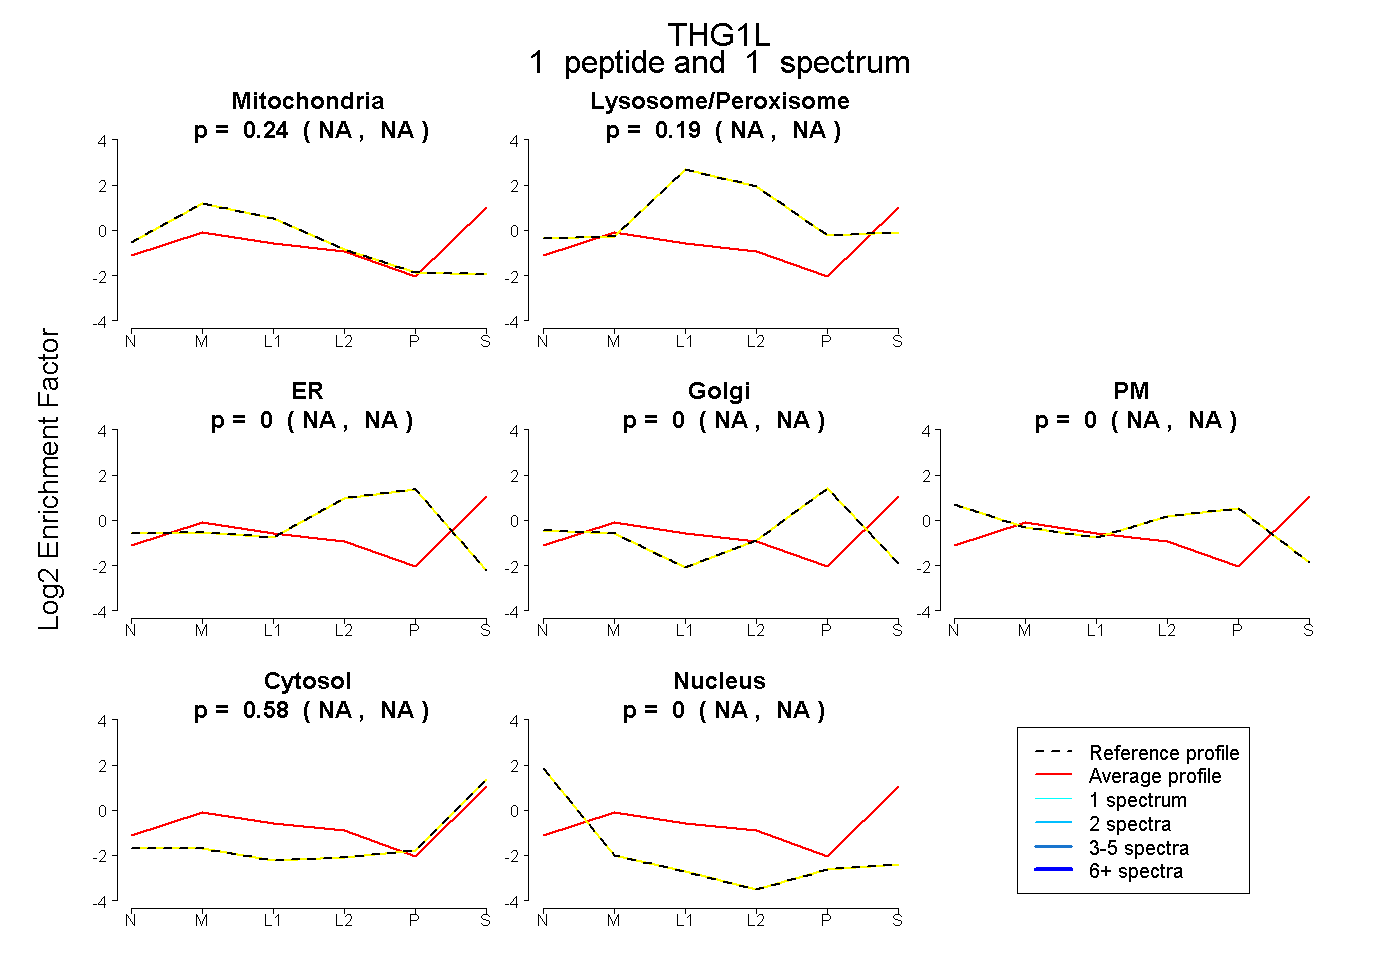 |
0.235 NA | NA |
0.186 NA | NA |
0.000 NA | NA |
0.000 NA | NA |
0.000 NA | NA |
0.579 NA | NA |
0.000 NA | NA |
|||
| Plot | Lyso | Other | |||||||||||
| Expt C |
4 peptides |
10 spectra |
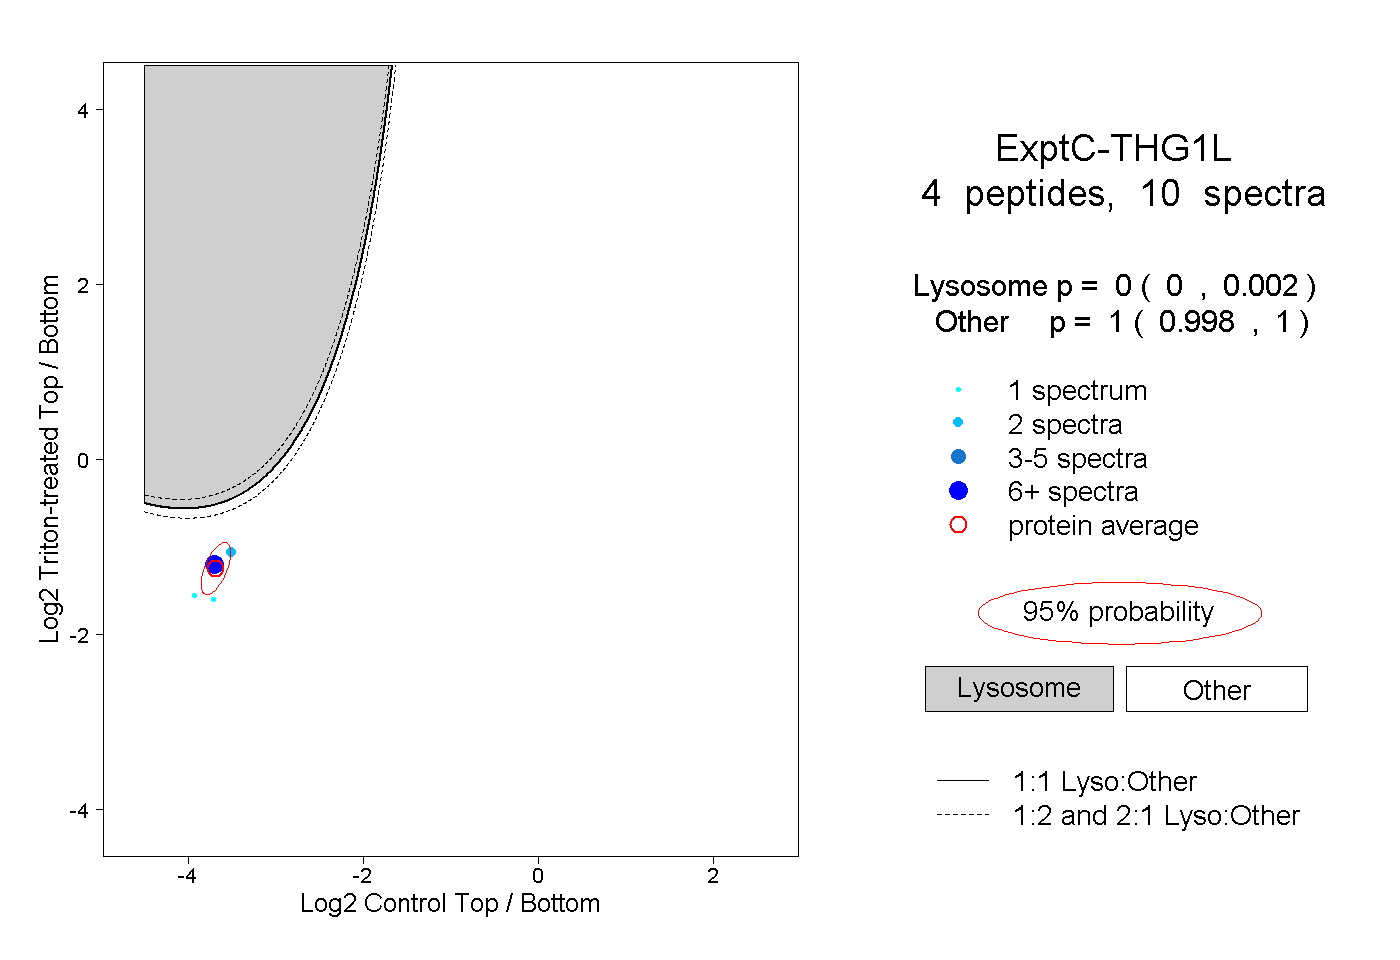 |
0.000 0.000 | 0.002 |
1.000 0.998 | 1.000 |