 5
5peptides
spectra
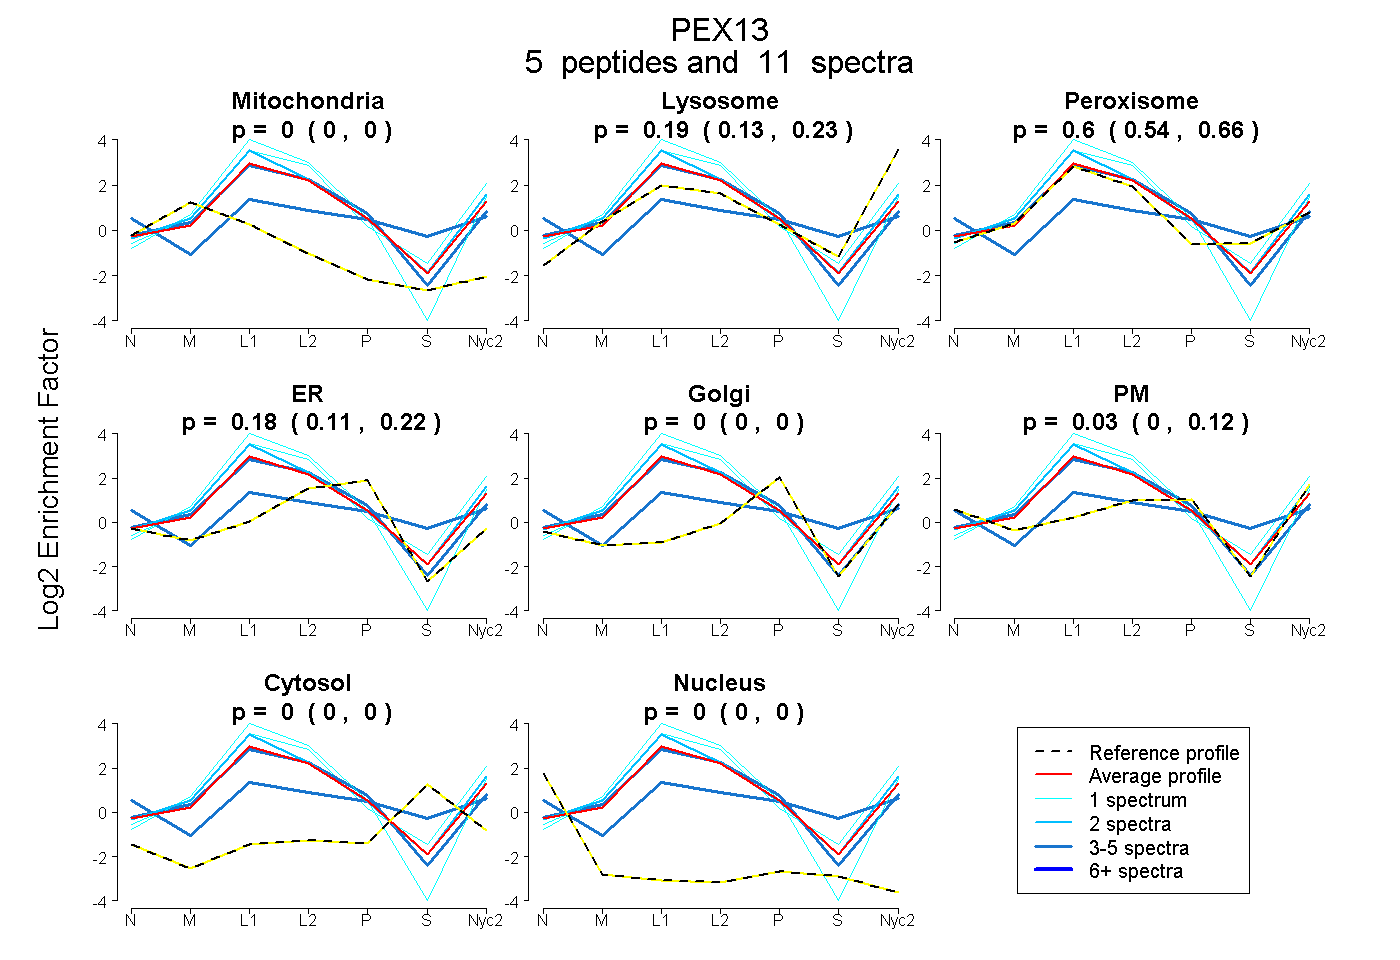
0.000 | 0.000
0.129 | 0.229
0.539 | 0.663
0.108 | 0.220
0.000 | 0.000
0.000 | 0.116
0.000 | 0.000
0.000 | 0.000
2peptides
spectra
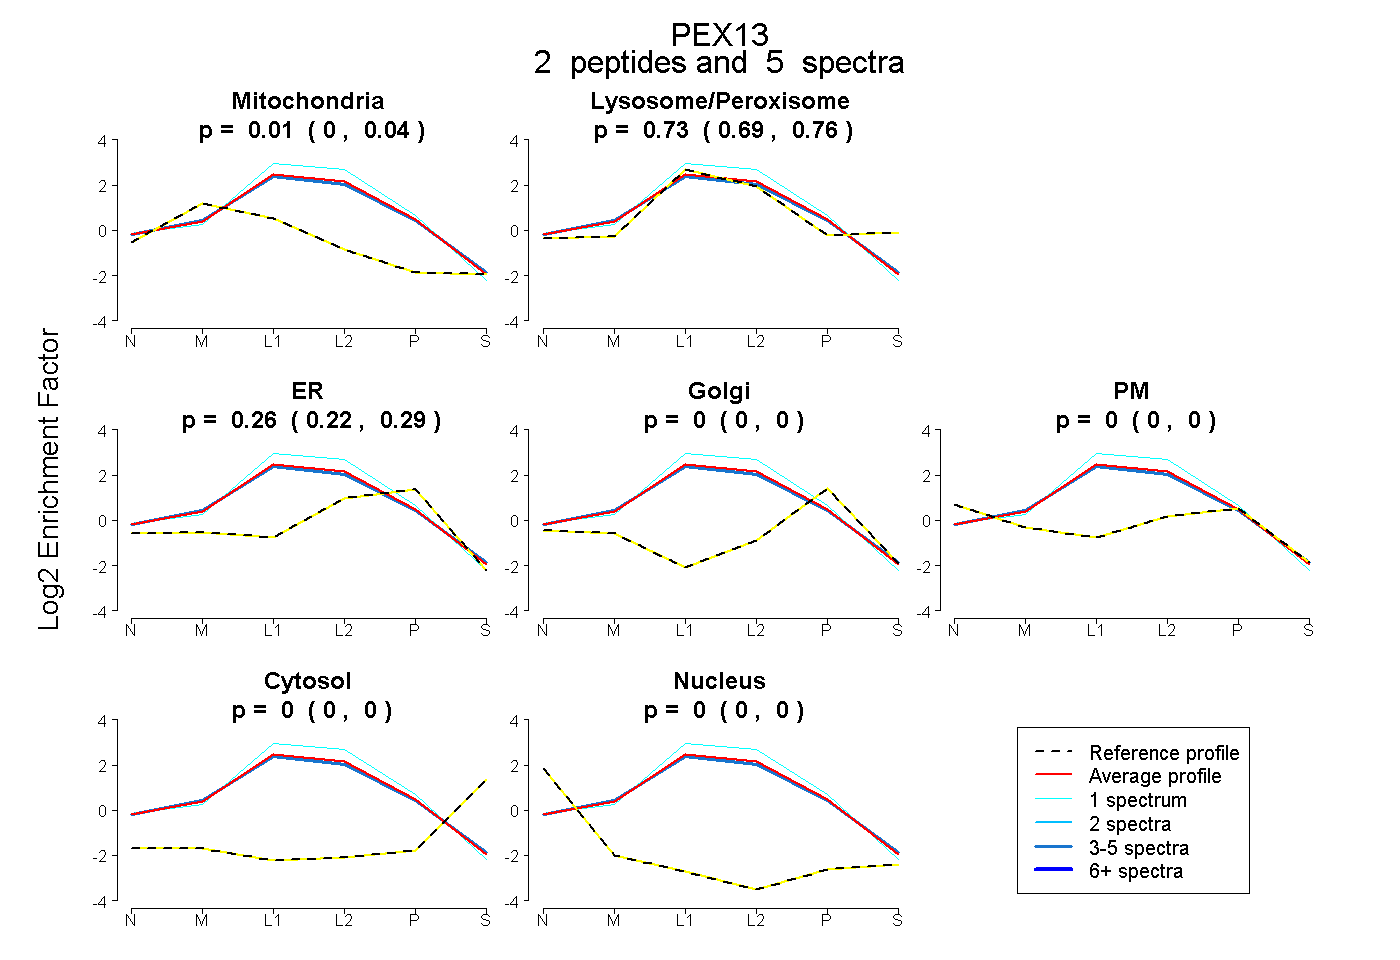
0.000 | 0.045
0.685 | 0.760
0.218 | 0.291
0.000 | 0.000
0.000 | 0.000
0.000 | 0.000
0.000 | 0.000
6peptides
spectra
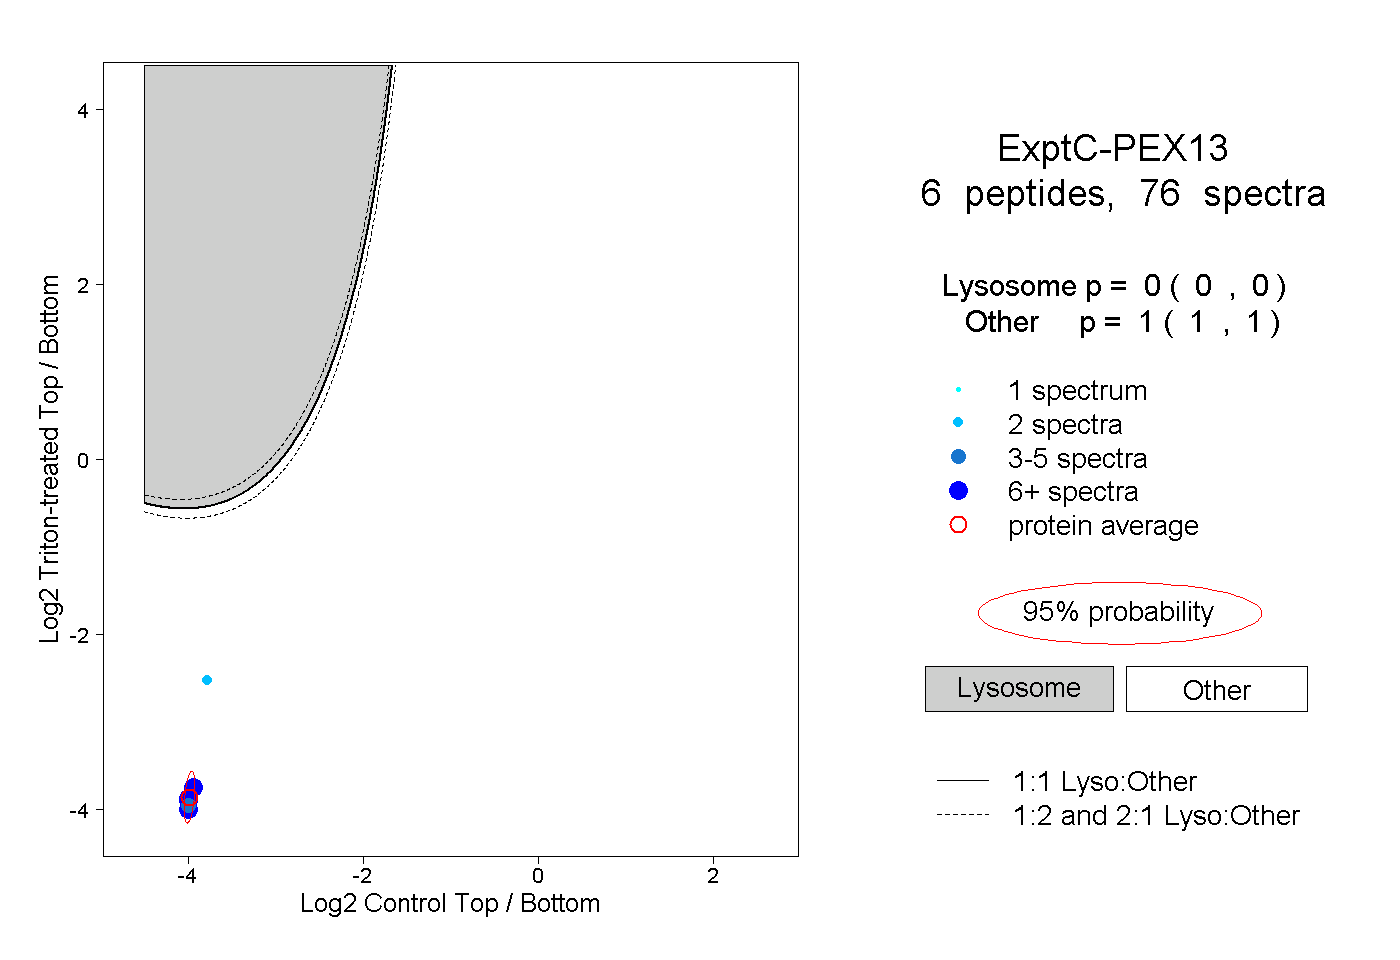
0.000 | 0.000
1.000 | 1.000
4peptides
spectra
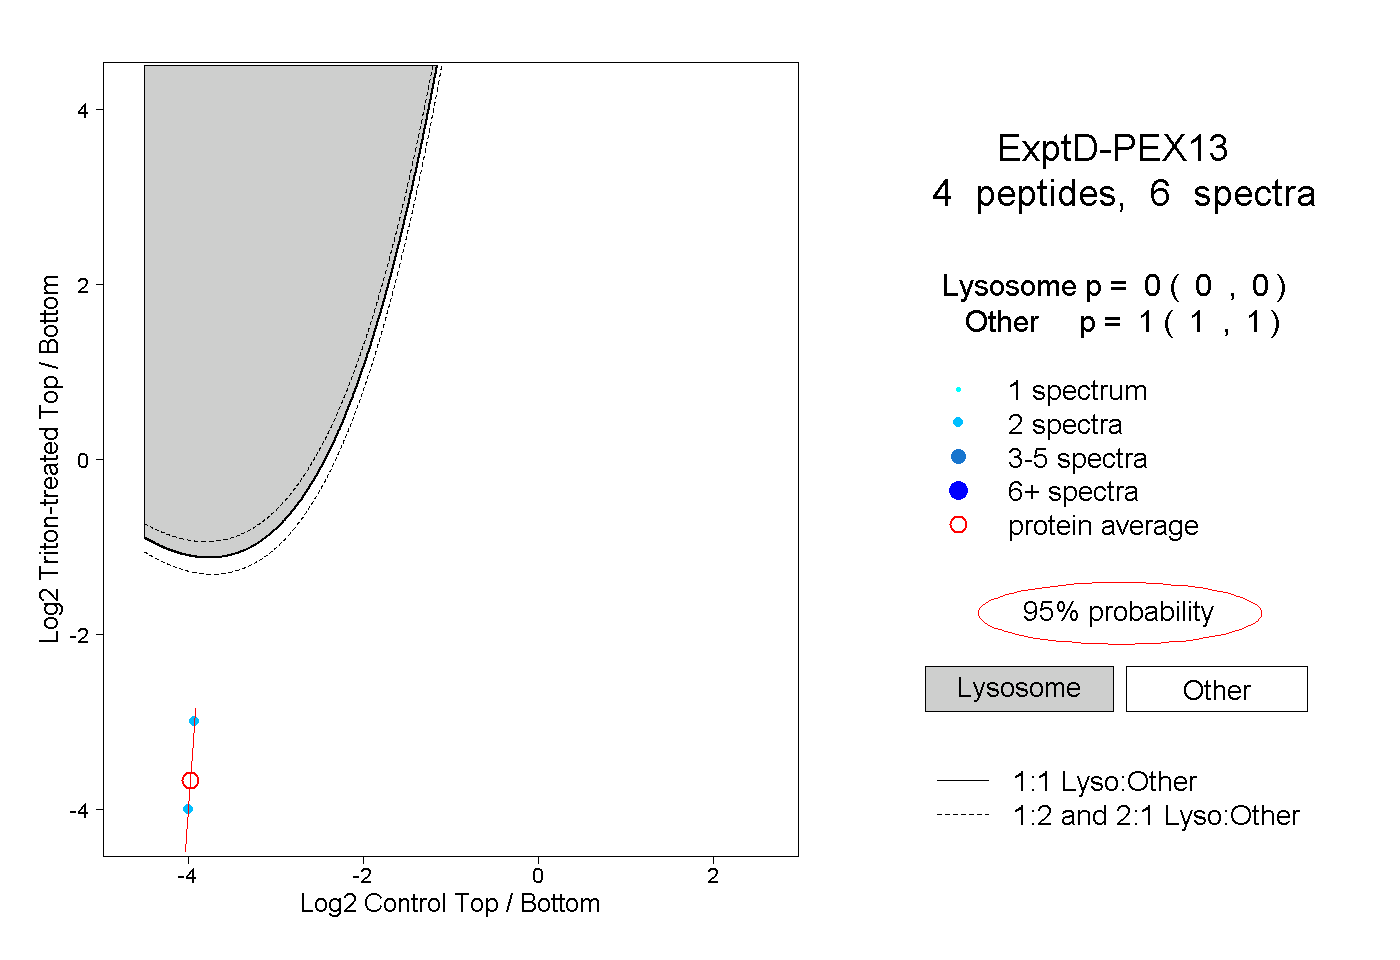
0.000 | 0.000
1.000 | 1.000