 5
5peptides
spectra
0.000 | 0.000
0.129 | 0.229
0.539 | 0.663
0.108 | 0.220
0.000 | 0.000
0.000 | 0.116
0.000 | 0.000
0.000 | 0.000
| Plot | Mito | Lyso | Perox | ER | Golgi | PM | Cytosol | Nucleus | |||||
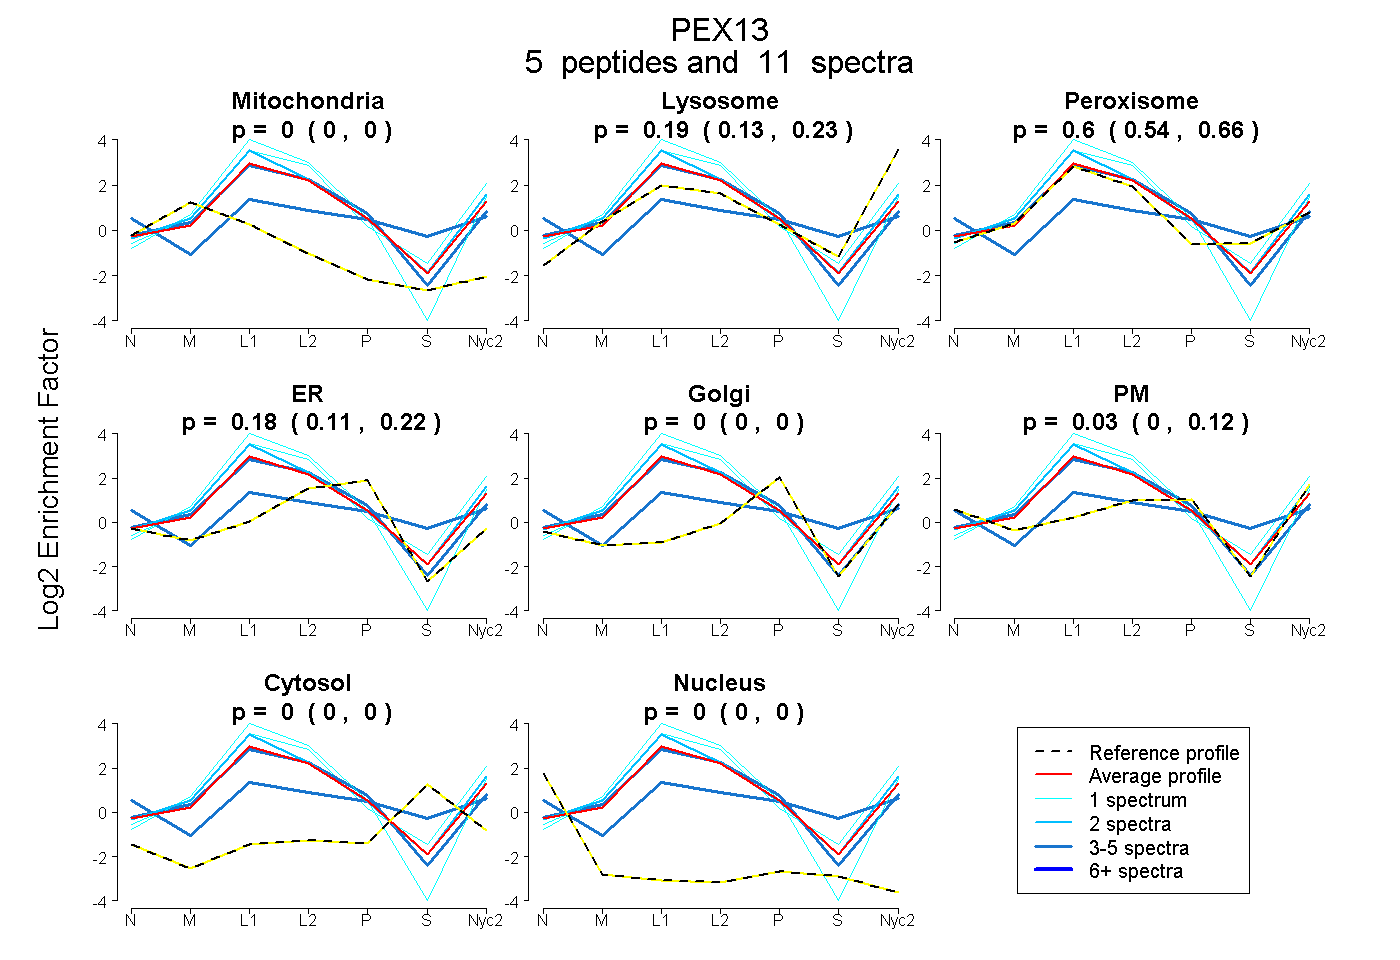
| Expt A |
5 peptides |
11 spectra |
|
0.000 0.000 | 0.000 |
0.186 0.129 | 0.229 |
0.605 0.539 | 0.663 |
0.177 0.108 | 0.220 |
0.000 0.000 | 0.000 |
0.032 0.000 | 0.116 |
0.000 0.000 | 0.000 |
0.000 0.000 | 0.000 |
| 1 spectrum, QQQSFTNPTSVK | 0.000 | 0.317 | 0.483 | 0.200 | 0.000 | 0.000 | 0.000 | 0.000 | ||
| 4 spectra, AVLDVANHFSR | 0.000 | 0.000 | 0.421 | 0.034 | 0.000 | 0.338 | 0.207 | 0.000 | ||
| 1 spectrum, AGDMLNLALK | 0.000 | 0.371 | 0.629 | 0.000 | 0.000 | 0.000 | 0.000 | 0.000 | ||
| 2 spectra, VFSAFALVR | 0.000 | 0.270 | 0.654 | 0.075 | 0.000 | 0.000 | 0.000 | 0.000 | ||
| 3 spectra, FVQQAEESSR | 0.000 | 0.097 | 0.579 | 0.323 | 0.000 | 0.000 | 0.000 | 0.000 |
| Plot | Mito | Lyso or Perox | ER | Golgi | PM | Cytosol | Nucleus | ||||||
| Expt B |
2 peptides |
5 spectra |
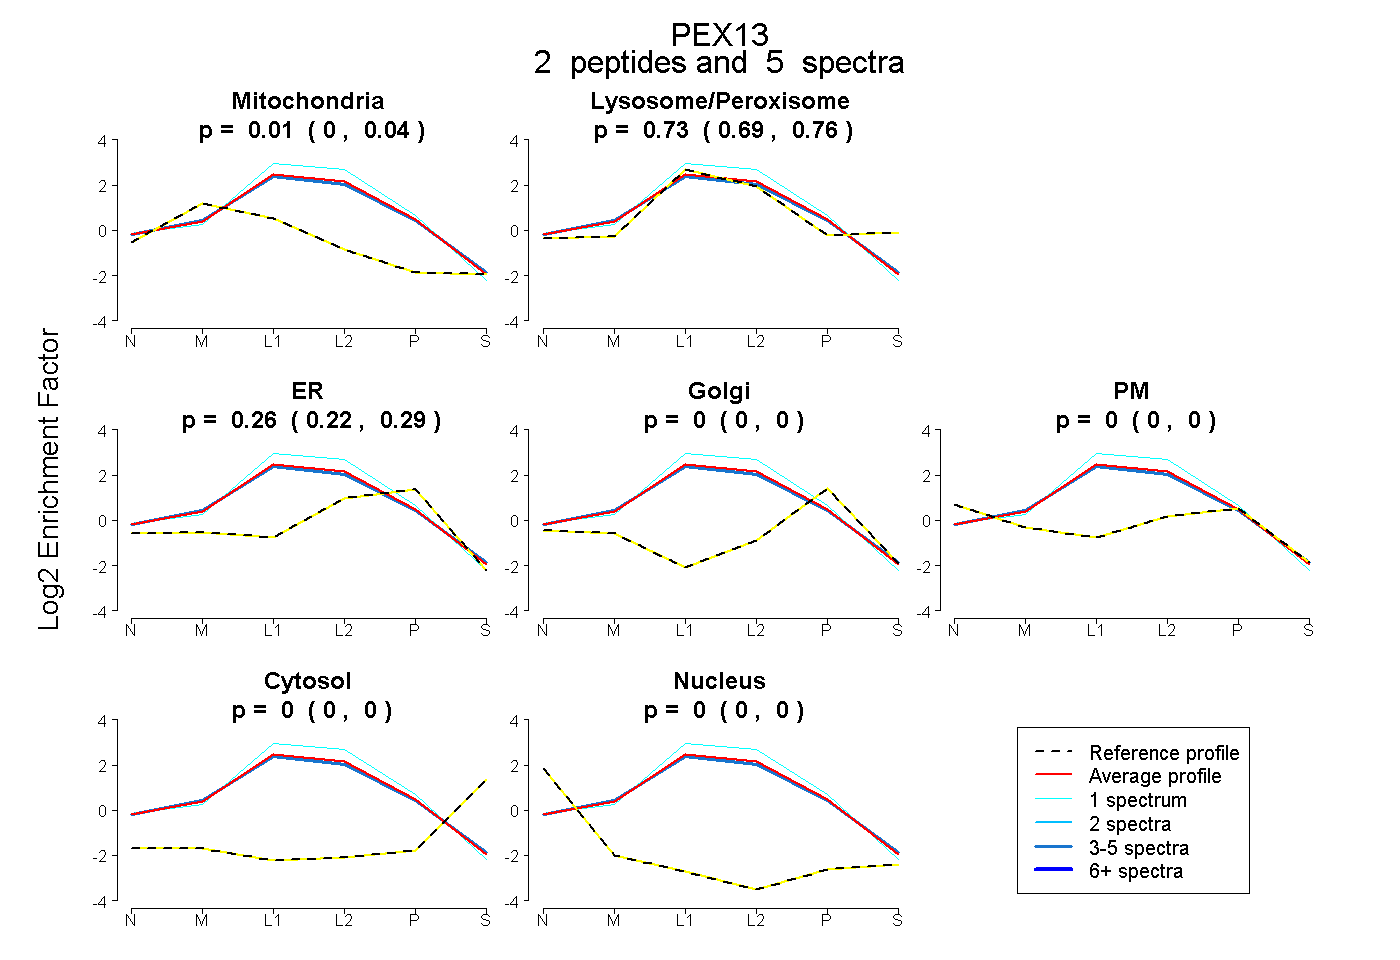 |
0.011 0.000 | 0.045 |
0.729 0.685 | 0.760 |
0.260 0.218 | 0.291 |
0.000 0.000 | 0.000 |
0.000 0.000 | 0.000 |
0.000 0.000 | 0.000 |
0.000 0.000 | 0.000 |
|||
| Plot | Lyso | Other | |||||||||||
| Expt C |
6 peptides |
76 spectra |
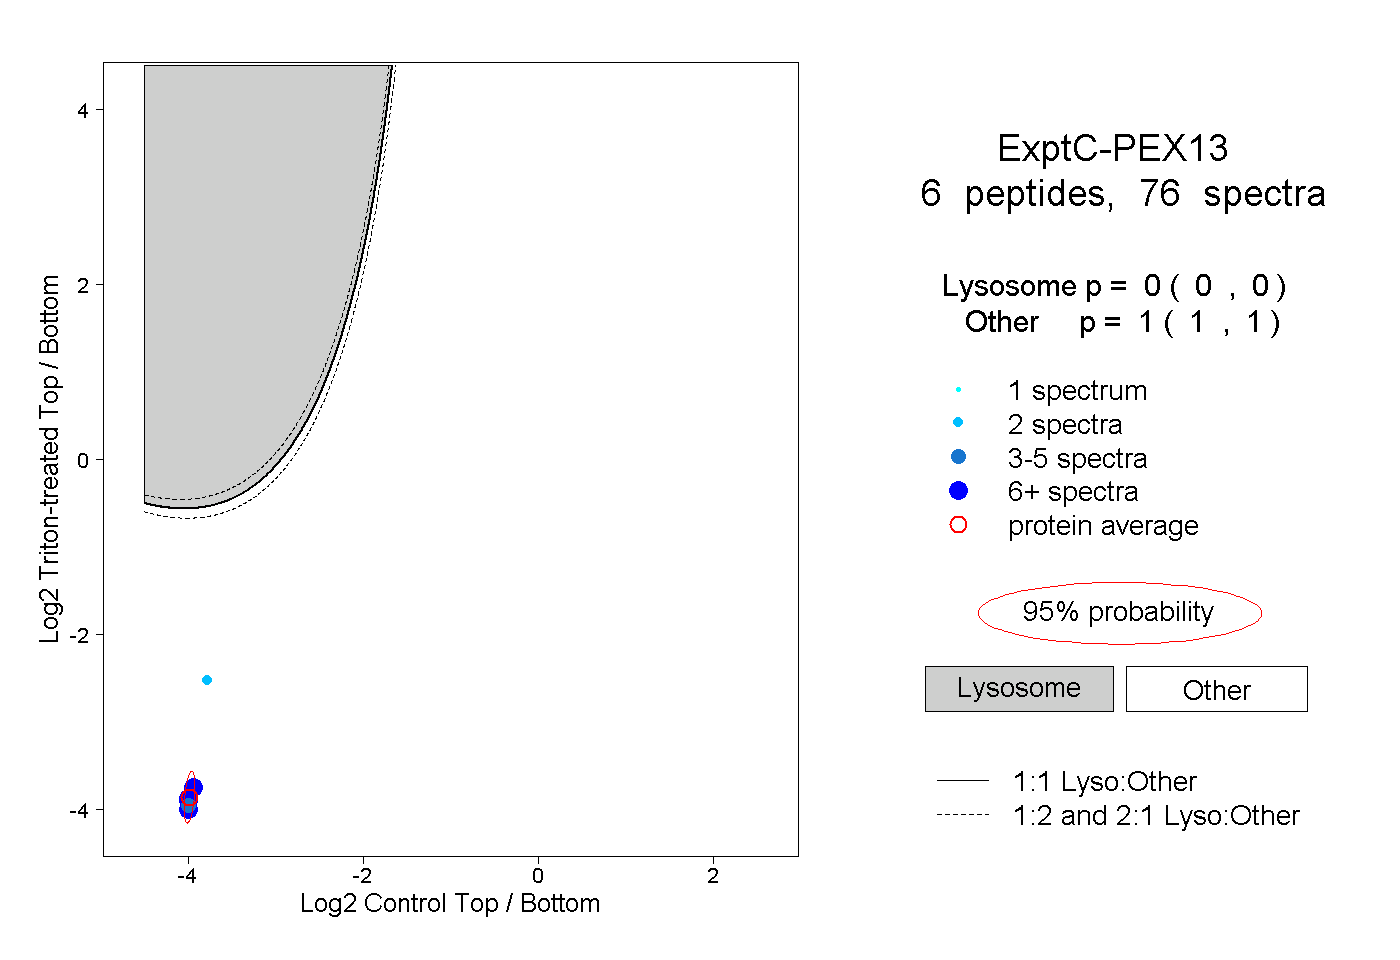 |
0.000 0.000 | 0.000 |
1.000 1.000 | 1.000 |
||||||||
| Plot | Lyso | Other | |||||||||||
| Expt D |
4 peptides |
6 spectra |
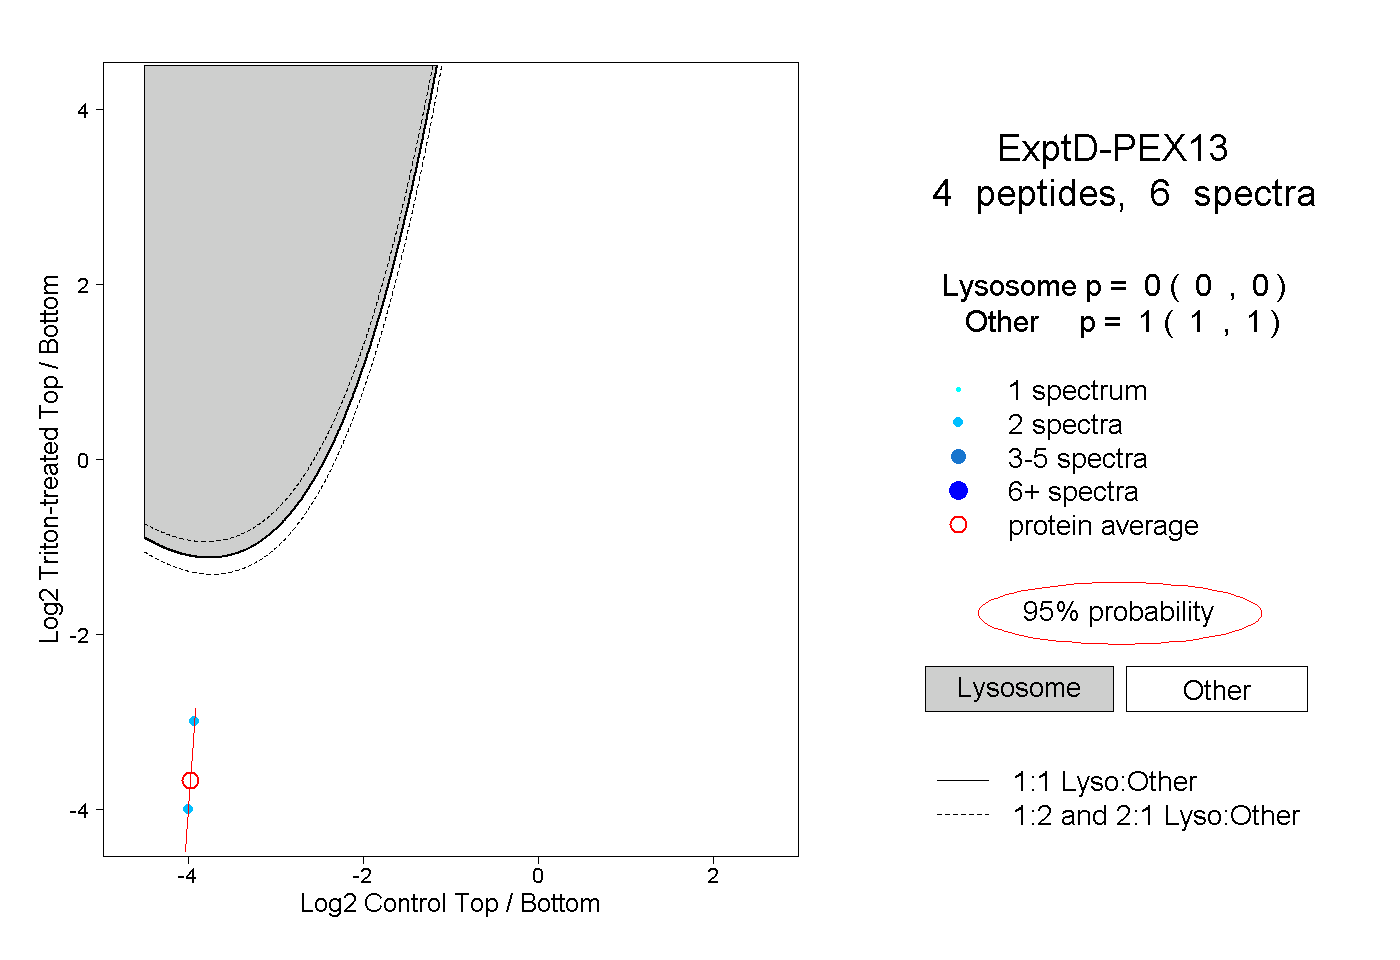 |
0.000 0.000 | 0.000 |
1.000 1.000 | 1.000 |