 7
7peptides
spectra
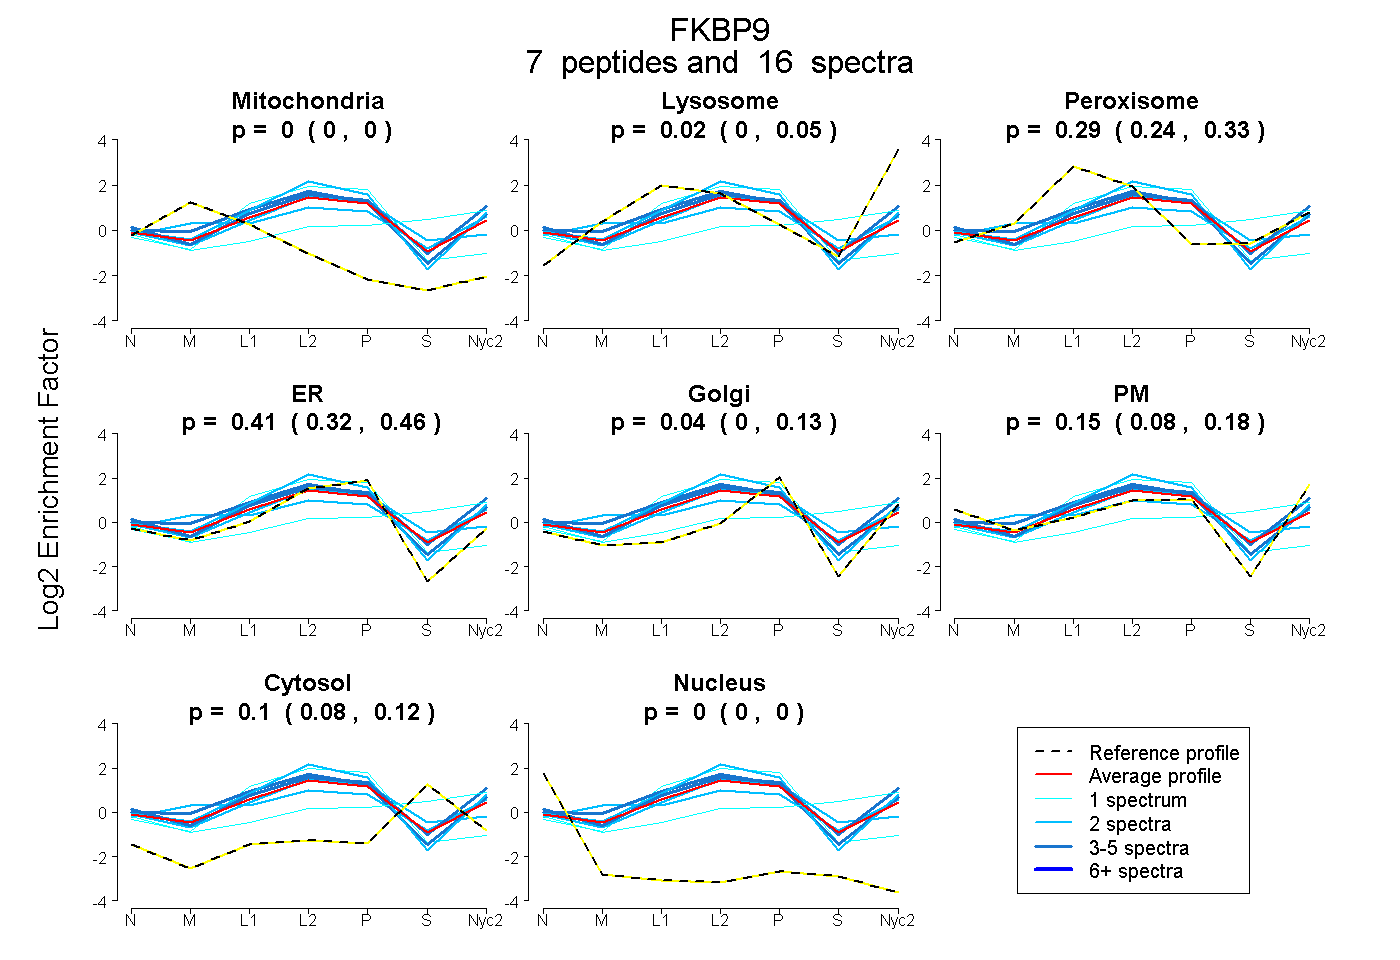
0.000 | 0.000
0.000 | 0.048
0.244 | 0.334
0.318 | 0.457
0.000 | 0.130
0.084 | 0.182
0.078 | 0.122
0.000 | 0.000
1peptide
spectra
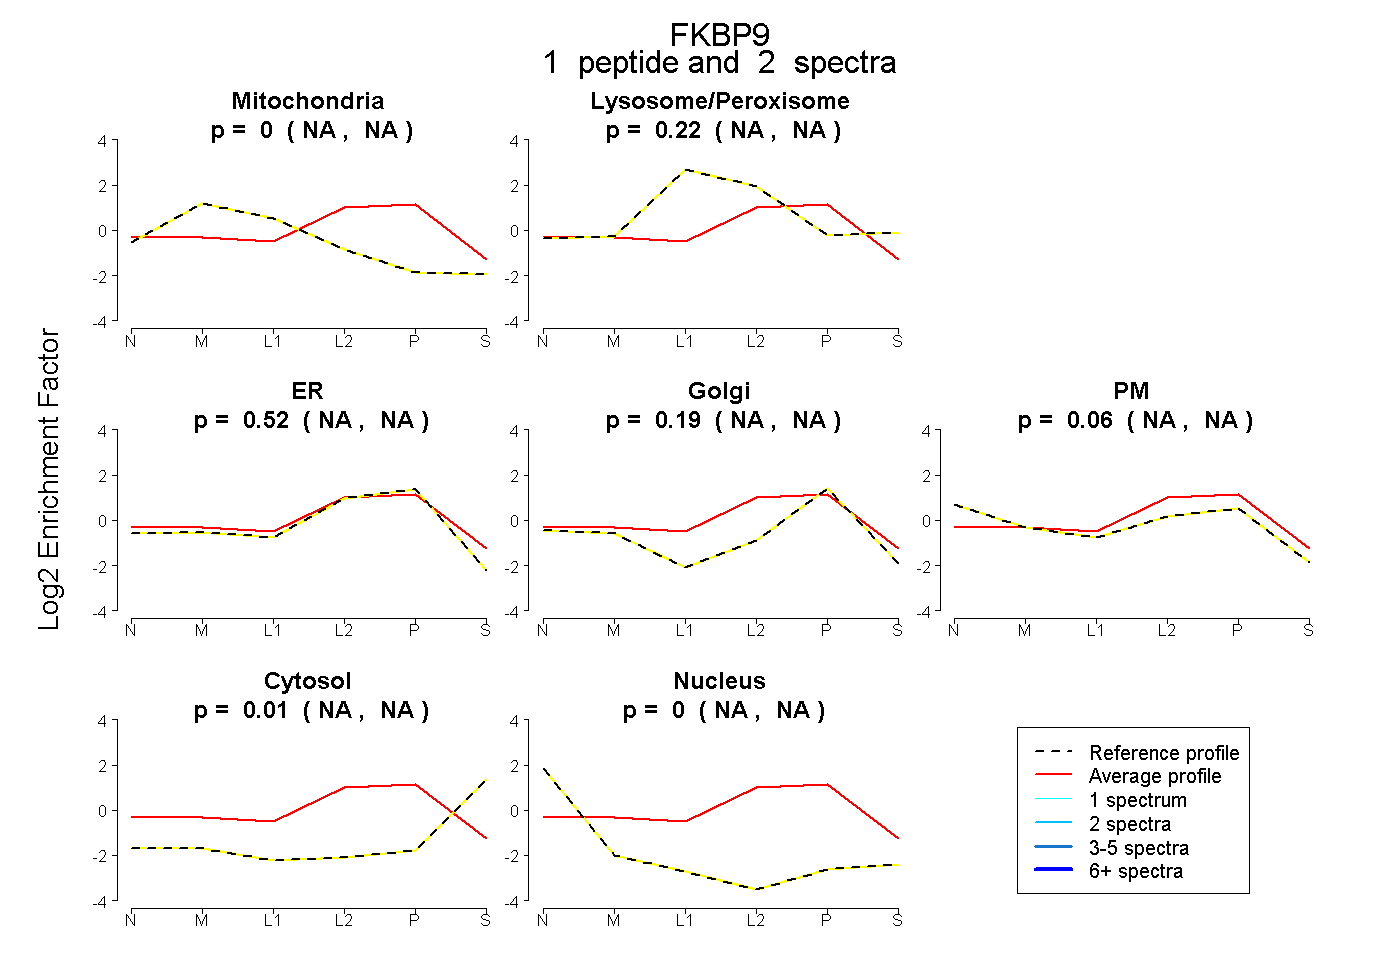
NA | NA
NA | NA
NA | NA
NA | NA
NA | NA
NA | NA
NA | NA
13peptides
spectra
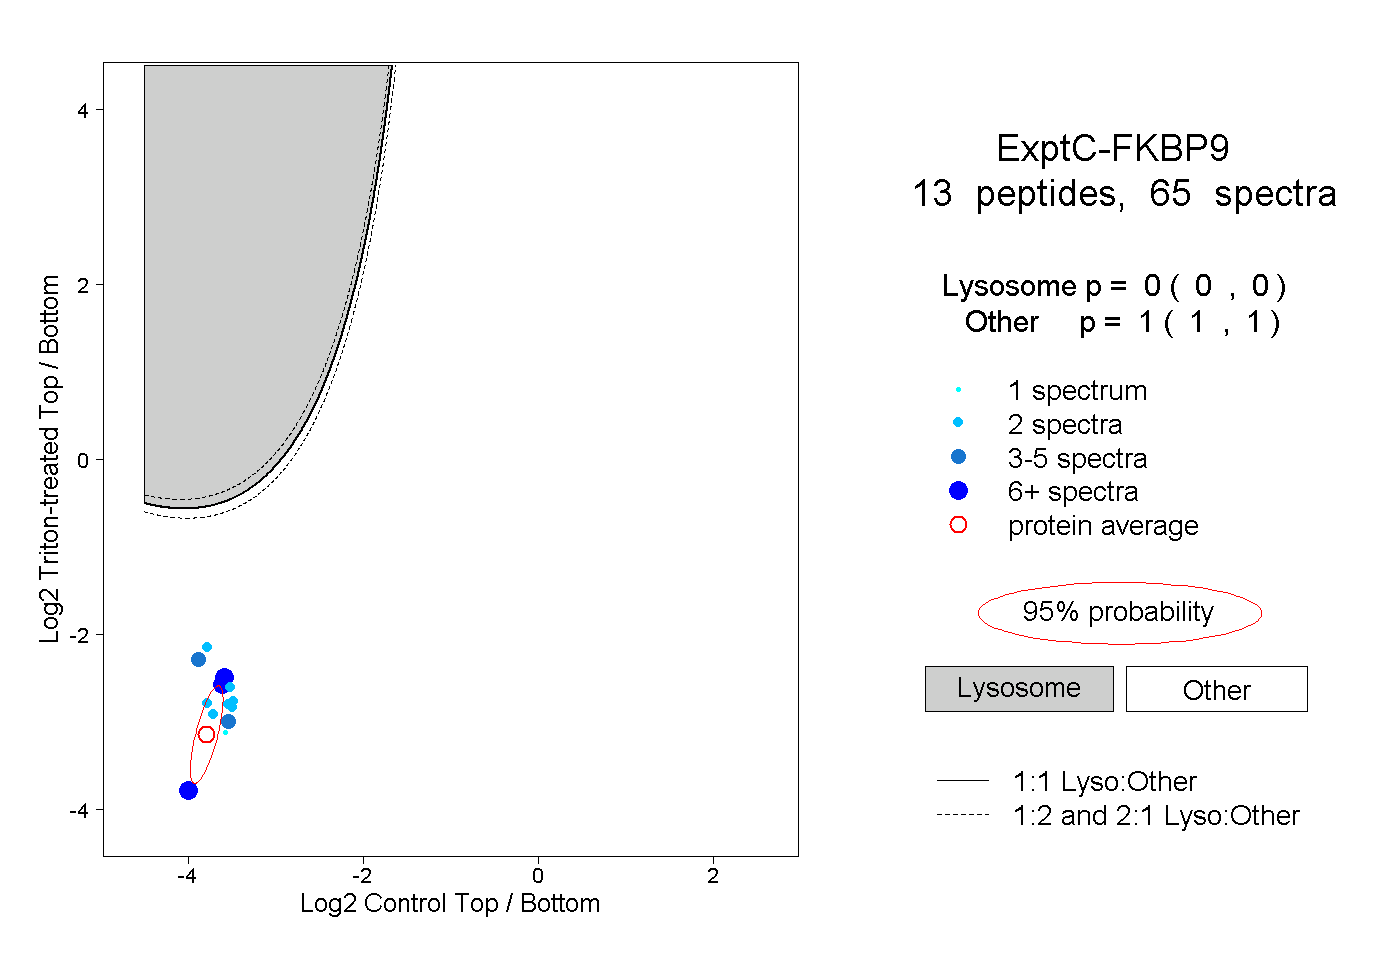
0.000 | 0.000
1.000 | 1.000
1peptide
spectrum
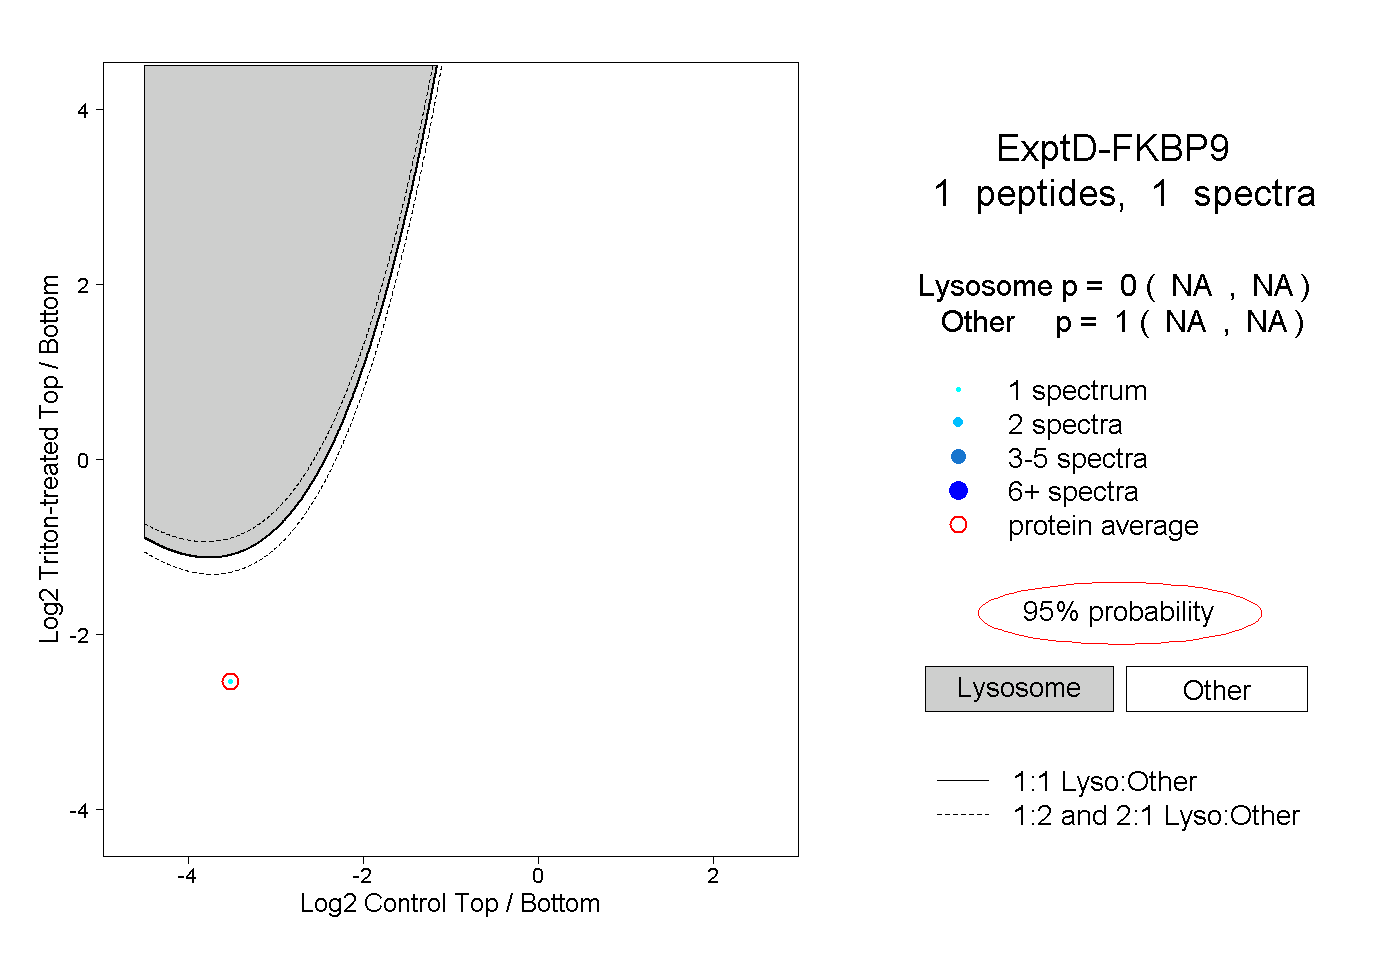
NA | NA
NA | NA