 7
7peptides
spectra
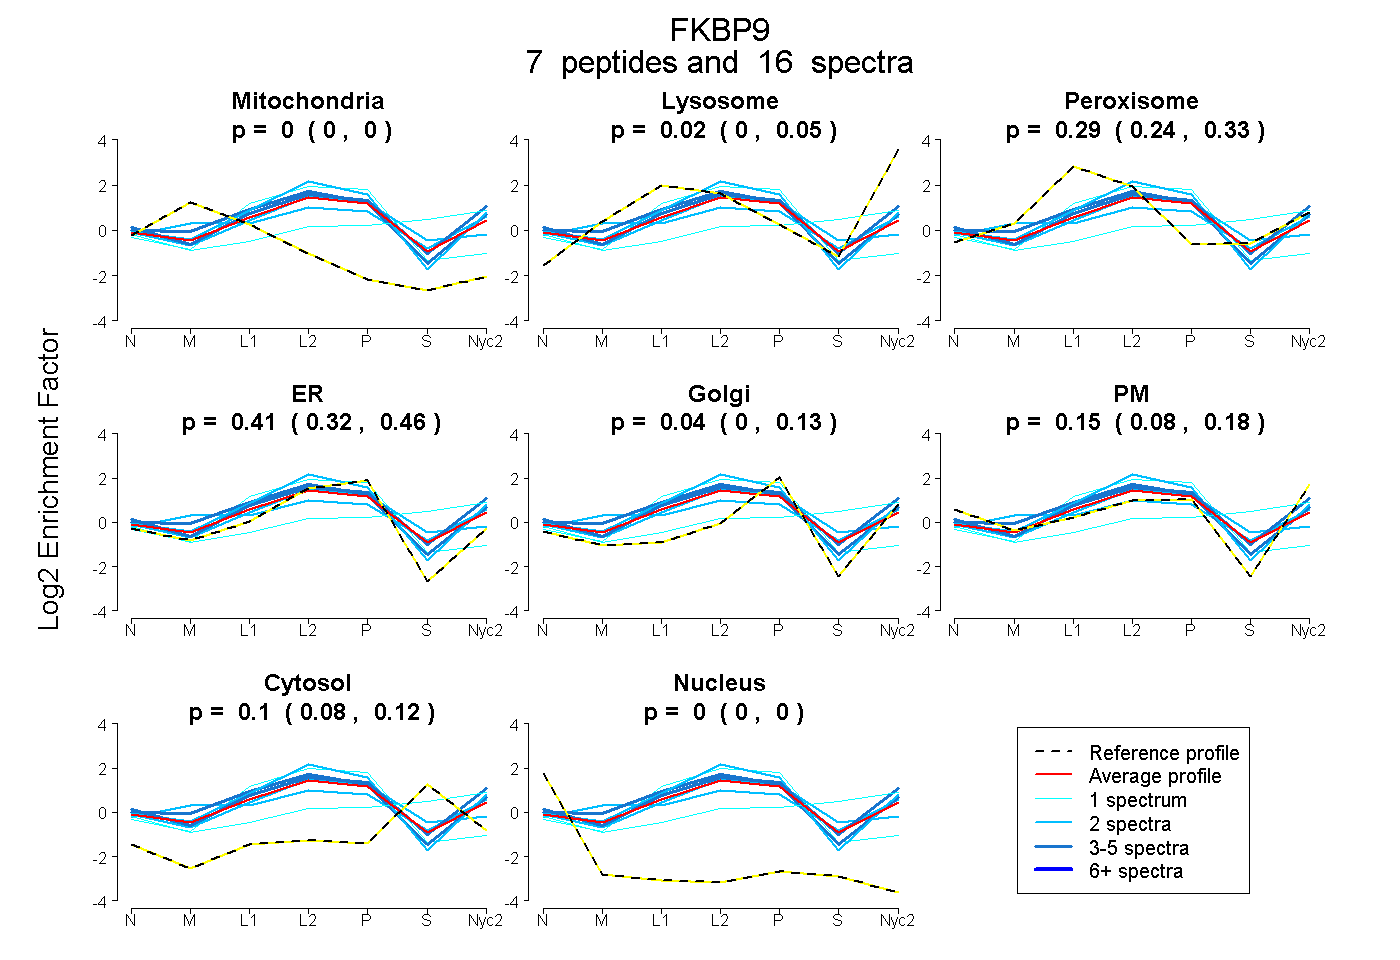
0.000 | 0.000
0.000 | 0.048
0.244 | 0.334
0.318 | 0.457
0.000 | 0.130
0.084 | 0.182
0.078 | 0.122
0.000 | 0.000
| Plot | Mito | Lyso | Perox | ER | Golgi | PM | Cytosol | Nucleus | |||||
| Expt A |
7 peptides |
16 spectra |
|
0.000 0.000 | 0.000 |
0.017 0.000 | 0.048 |
0.290 0.244 | 0.334 |
0.408 0.318 | 0.457 |
0.035 0.000 | 0.130 |
0.146 0.084 | 0.182 |
0.104 0.078 | 0.122 |
0.000 0.000 | 0.000 |
| 1 spectrum, YHYVGTFLDGQK | 0.000 | 0.141 | 0.032 | 0.000 | 0.000 | 0.350 | 0.477 | 0.000 | ||
| 2 spectra, TIQVSDFVR | 0.000 | 0.146 | 0.171 | 0.591 | 0.000 | 0.092 | 0.000 | 0.000 | ||
| 2 spectra, SFVPDECPR | 0.000 | 0.000 | 0.281 | 0.537 | 0.000 | 0.000 | 0.181 | 0.000 | ||
| 4 spectra, VVPESCER | 0.000 | 0.101 | 0.207 | 0.313 | 0.000 | 0.315 | 0.064 | 0.000 | ||
| 4 spectra, SGDFVR | 0.000 | 0.039 | 0.313 | 0.423 | 0.000 | 0.225 | 0.000 | 0.000 | ||
| 1 spectrum, GLLGMCVGEK | 0.000 | 0.000 | 0.250 | 0.727 | 0.000 | 0.000 | 0.023 | 0.000 | ||
| 2 spectra, IVVPPHLGYGEEGR | 0.016 | 0.000 | 0.407 | 0.037 | 0.351 | 0.116 | 0.074 | 0.000 |
| Plot | Mito | Lyso or Perox | ER | Golgi | PM | Cytosol | Nucleus | ||||||
| Expt B |
1 peptide |
2 spectra |
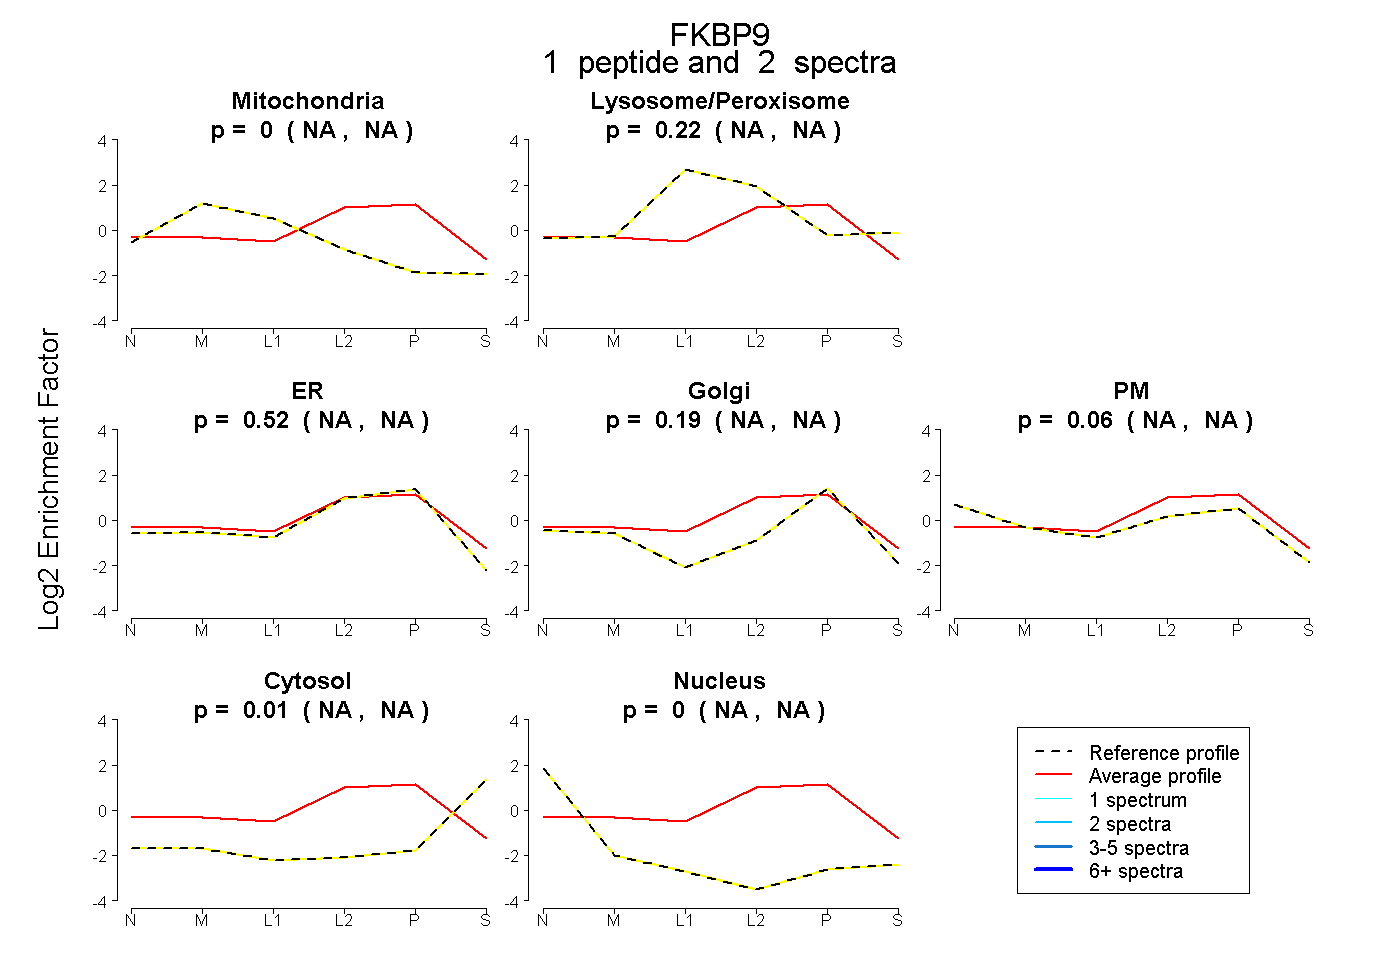 |
0.000 NA | NA |
0.220 NA | NA |
0.519 NA | NA |
0.195 NA | NA |
0.061 NA | NA |
0.006 NA | NA |
0.000 NA | NA |
|||
| Plot | Lyso | Other | |||||||||||
| Expt C |
13 peptides |
65 spectra |
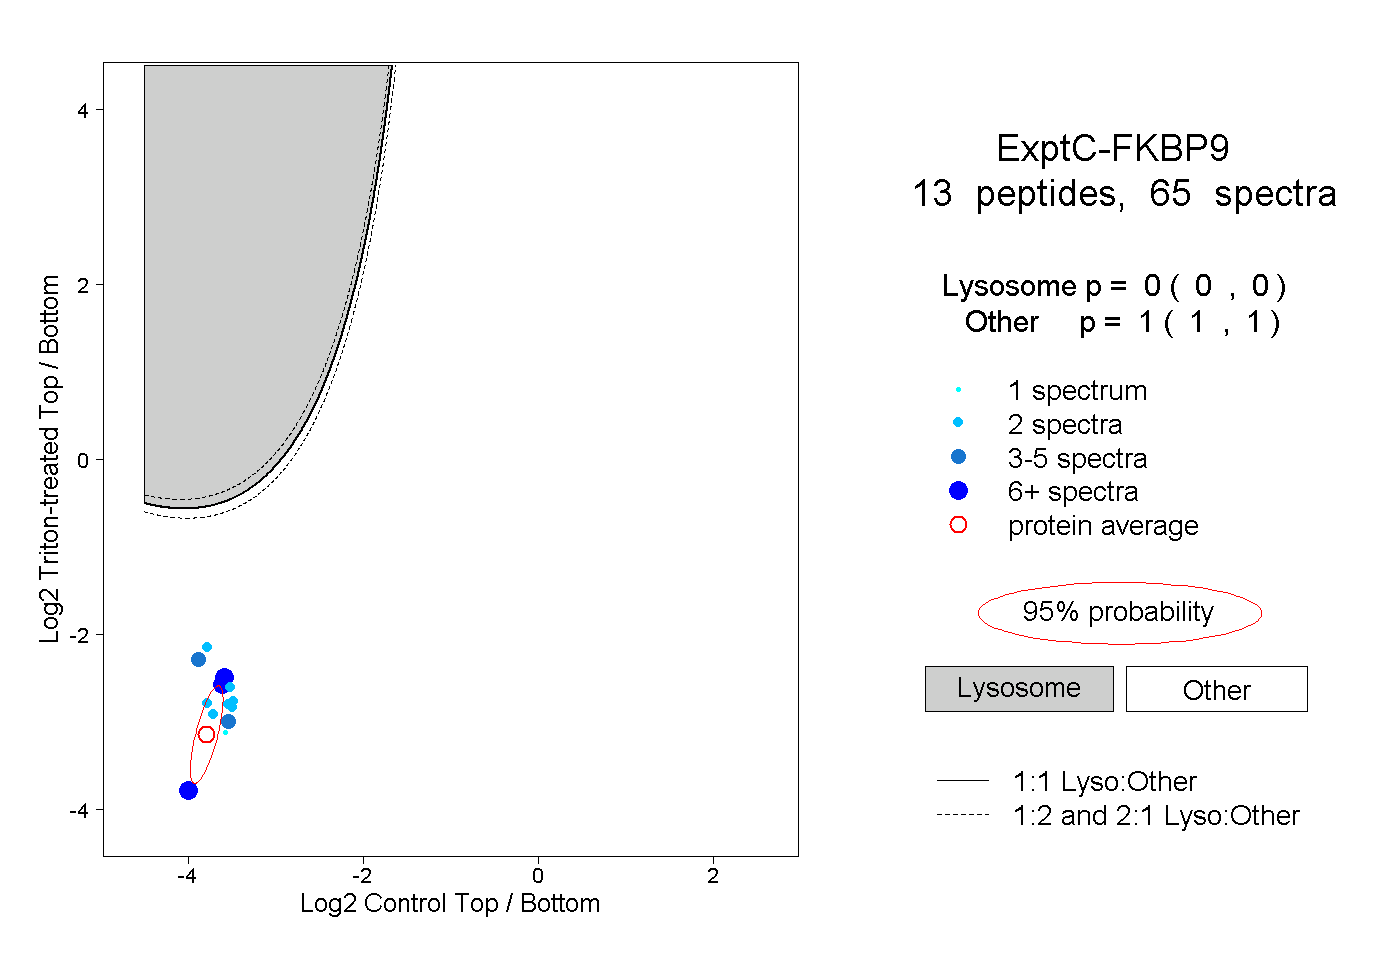 |
0.000 0.000 | 0.000 |
1.000 1.000 | 1.000 |
||||||||
| Plot | Lyso | Other | |||||||||||
| Expt D |
1 peptide |
1 spectrum |
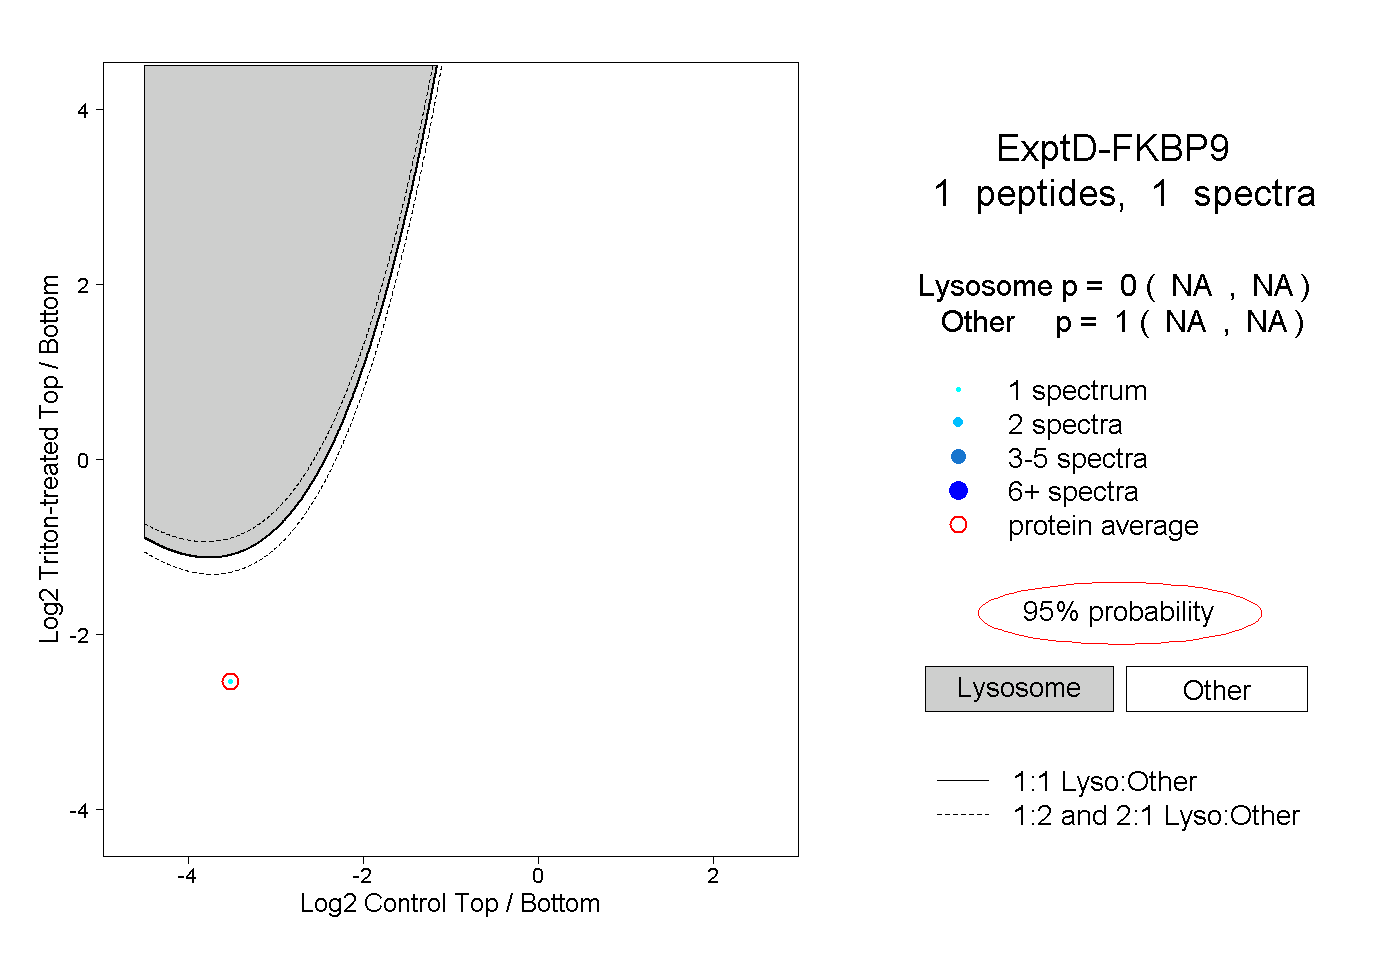 |
0.000 NA | NA |
1.000 NA | NA |